Fig. 12
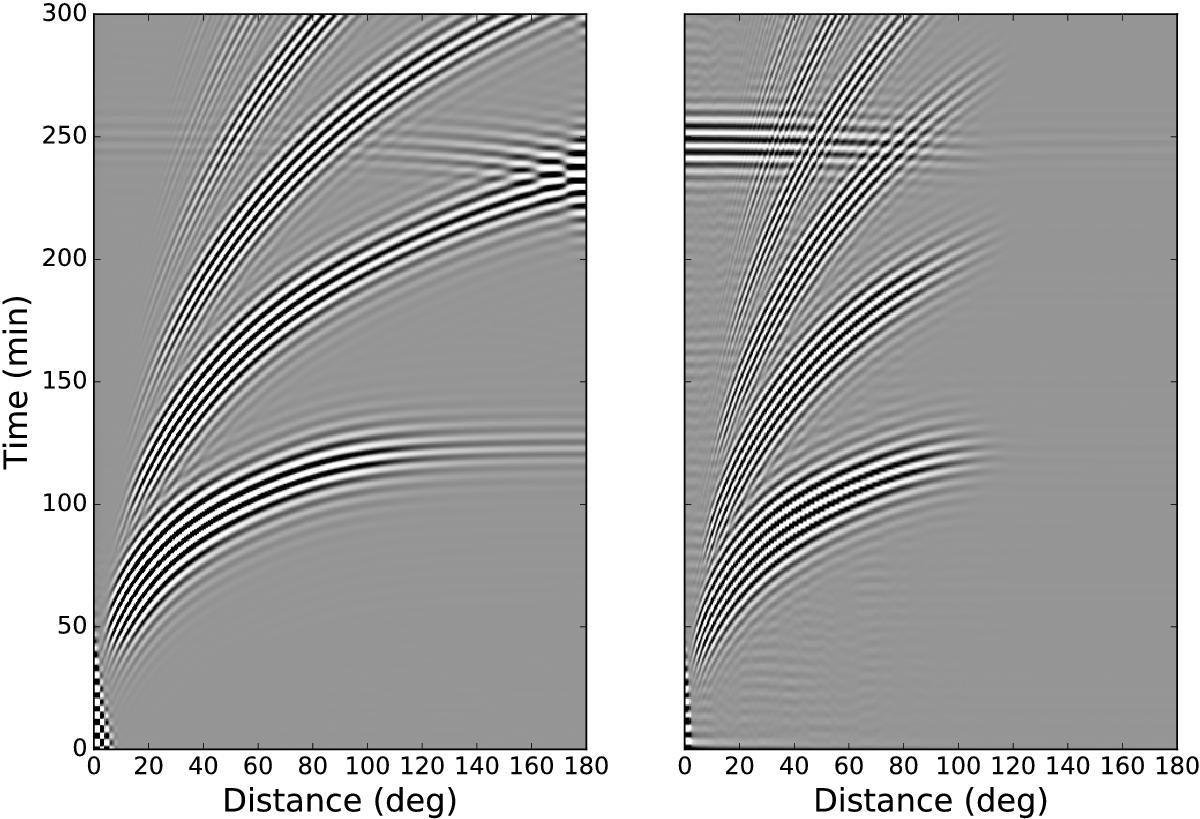
Left: time-distance diagram computed from Eq. (87)at the height of the Dirac source. Right: observational time-distance diagram computed from the Fourier transform of the SOHO/MDI/Doppler medium-degree power spectrum (Kosovichev et al. 1997). The SOHO/MDI time-distance diagram fades away at large separation distances due to foreshortening.
Current usage metrics show cumulative count of Article Views (full-text article views including HTML views, PDF and ePub downloads, according to the available data) and Abstracts Views on Vision4Press platform.
Data correspond to usage on the plateform after 2015. The current usage metrics is available 48-96 hours after online publication and is updated daily on week days.
Initial download of the metrics may take a while.