Fig. 17
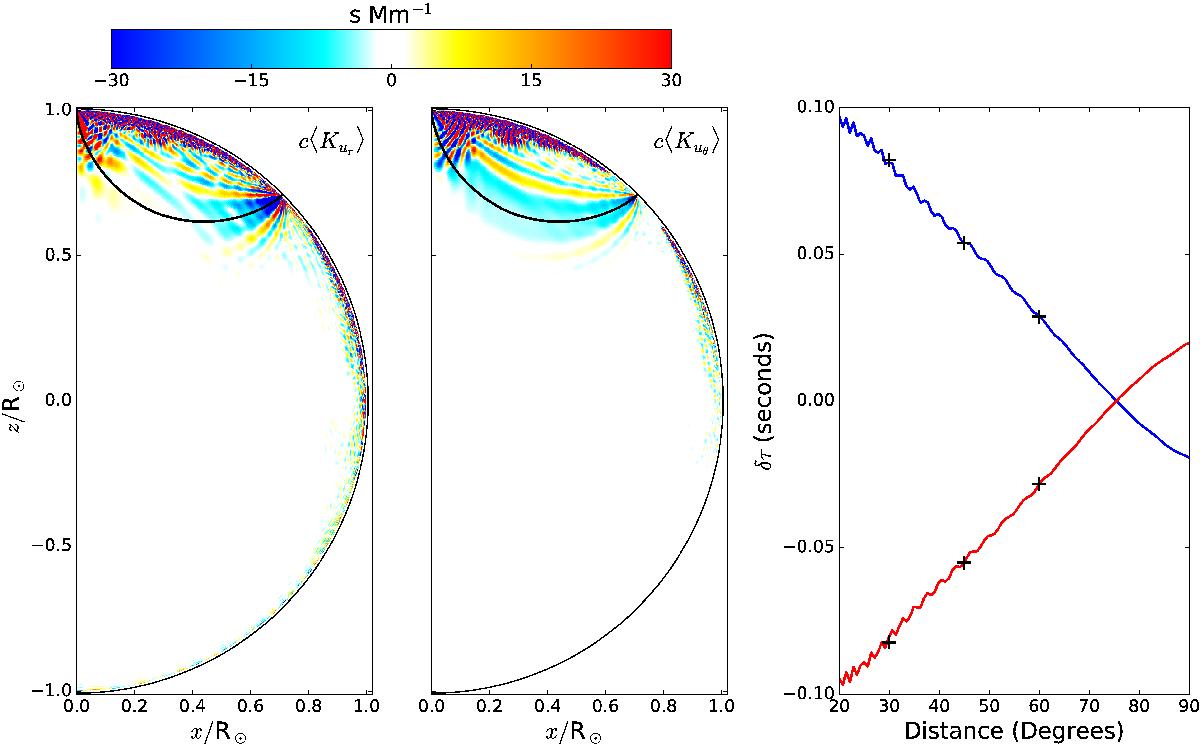
Left and center panels: kernels ⟨ Kur ⟩ and ⟨ Kuθ ⟩ for the r and θ components of the flow. Point r1 is at the north pole (photosphere) and point r2 is at 45° latitude. The values of the kernels are scaled by the sound speed c and are saturated at 1/400 of the maximum value. The ray path connecting the two points is shown (thick black line) as well as the computational boundary (black half circle). Right panel: comparison between the travel times computed directly from the cross-covariance function (curves, see Eq. (25)) and those computed from the sensitivity kernels (“+” symbols, see Eq. (90)). The blue curve is for the travel times measured from the pole to latitude 45°, the red curve for the travel times measured in the opposite direction. The accuracy of the travel times is approximately 10-3 s.
Current usage metrics show cumulative count of Article Views (full-text article views including HTML views, PDF and ePub downloads, according to the available data) and Abstracts Views on Vision4Press platform.
Data correspond to usage on the plateform after 2015. The current usage metrics is available 48-96 hours after online publication and is updated daily on week days.
Initial download of the metrics may take a while.