Fig. 18
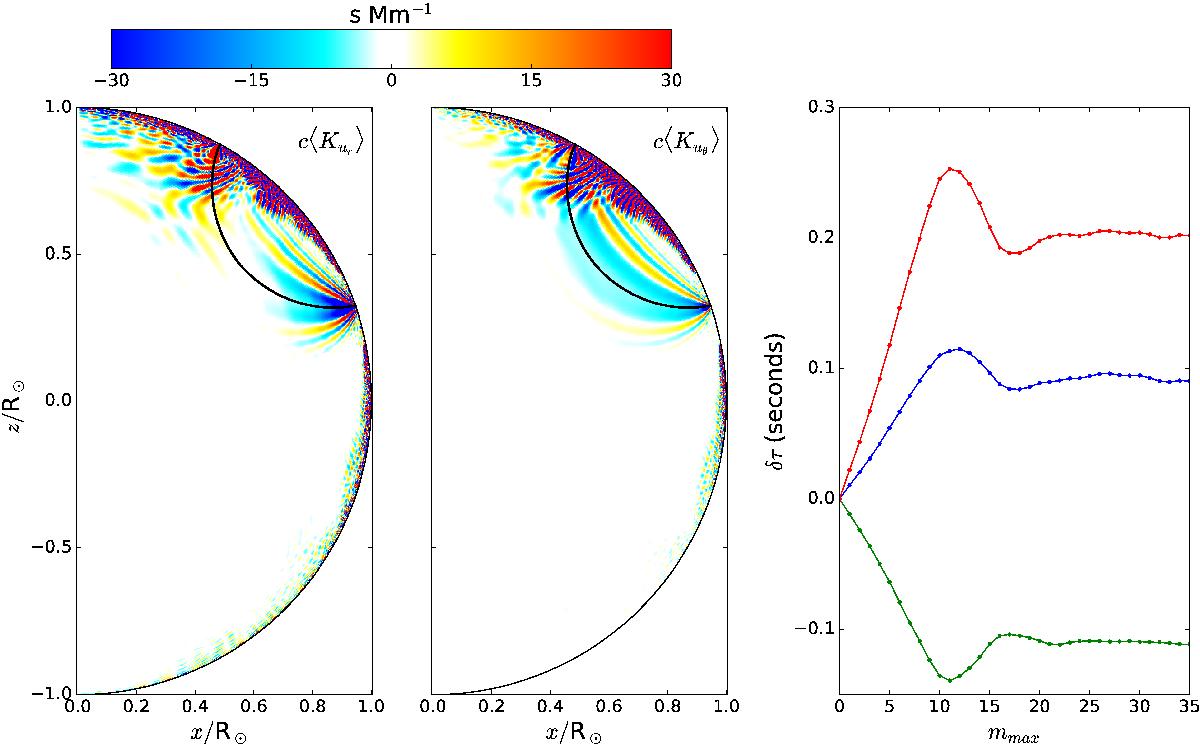
Left and center panels: kernels ⟨ Kur ⟩ and ⟨ Kuθ ⟩ for the r and θ components of the flow, using all azimuthal components | m | ≤ mmax = 35. The separation distance between points r1 and r2 is 42°; the center point is located at a latitude of 40°. The ray path connecting the two points is shown in black. The right panel shows the convergence of the travel times as a function of mmax, for the north-south (blue) and south-north (green) travel directions. The red curve shows their difference.
Current usage metrics show cumulative count of Article Views (full-text article views including HTML views, PDF and ePub downloads, according to the available data) and Abstracts Views on Vision4Press platform.
Data correspond to usage on the plateform after 2015. The current usage metrics is available 48-96 hours after online publication and is updated daily on week days.
Initial download of the metrics may take a while.