Free Access
Fig. 8
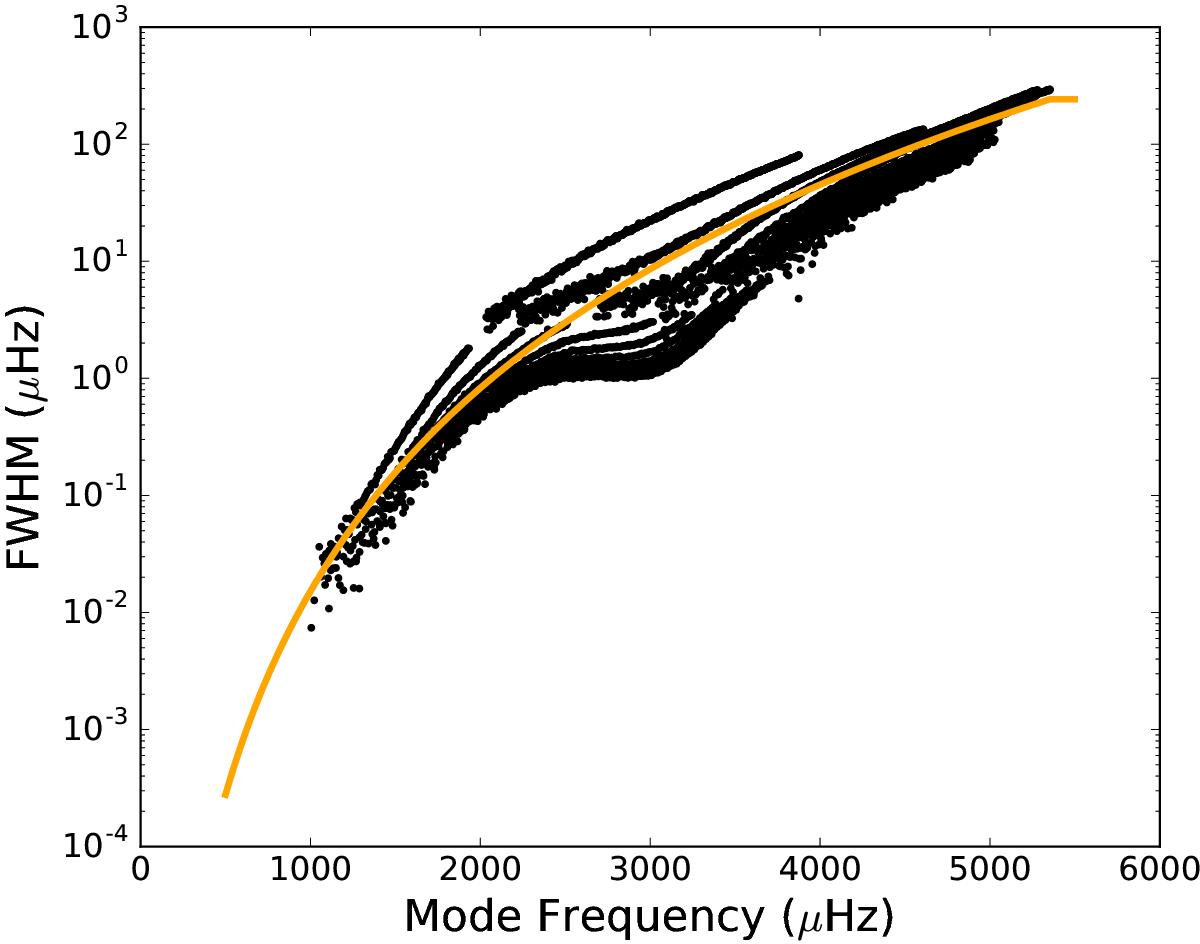
Observed full width at half maximum of acoustic modes with radial orders ![]() (black dots, Korzennik et al. 2013; Larson & Schou 2015), overplotted with the power law approximation used in the simulations (2γ(ω), orange line).
(black dots, Korzennik et al. 2013; Larson & Schou 2015), overplotted with the power law approximation used in the simulations (2γ(ω), orange line).
Current usage metrics show cumulative count of Article Views (full-text article views including HTML views, PDF and ePub downloads, according to the available data) and Abstracts Views on Vision4Press platform.
Data correspond to usage on the plateform after 2015. The current usage metrics is available 48-96 hours after online publication and is updated daily on week days.
Initial download of the metrics may take a while.