Fig. 9
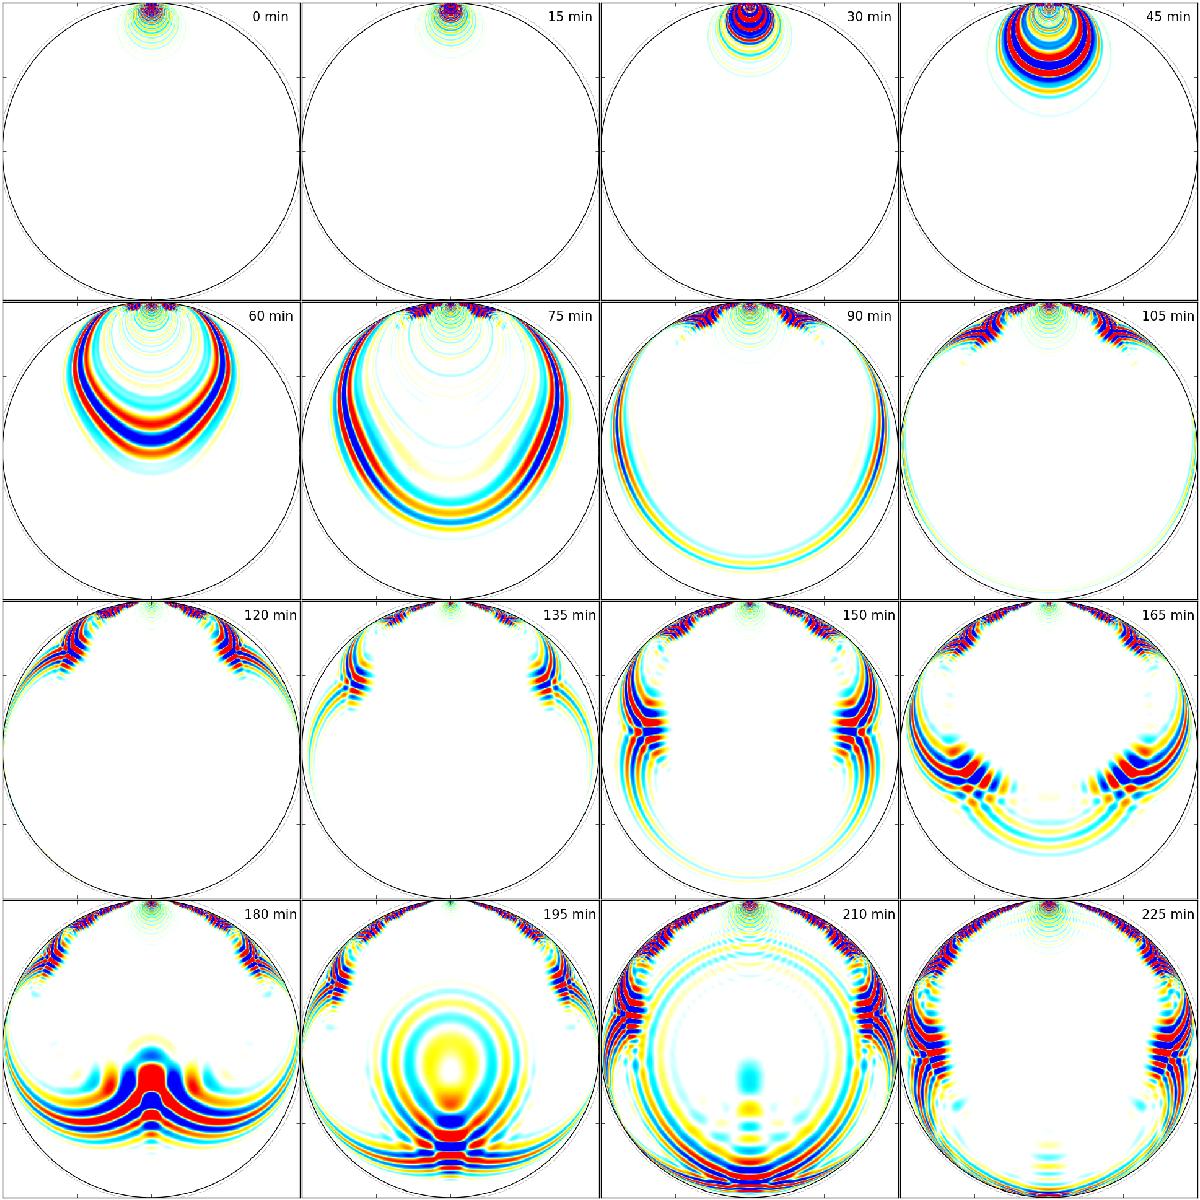
Snapshots of the inverse temporal Fourier transform of ![]() , propagating from a source located on the polar axis at the photosphere, where r belongs to a plane through the source and the center of the Sun. The time t, measured from the source time, is written in the top right of each panel. Each image is multiplied by ρ− 1/2exp(t/ 75min) for display purposes. The values are saturated at a hundredth of the maximum value for the whole time series. The first nine panels have been further saturated (by a factor 2) to improve the visibility of the first arrival wave.
, propagating from a source located on the polar axis at the photosphere, where r belongs to a plane through the source and the center of the Sun. The time t, measured from the source time, is written in the top right of each panel. Each image is multiplied by ρ− 1/2exp(t/ 75min) for display purposes. The values are saturated at a hundredth of the maximum value for the whole time series. The first nine panels have been further saturated (by a factor 2) to improve the visibility of the first arrival wave.
Current usage metrics show cumulative count of Article Views (full-text article views including HTML views, PDF and ePub downloads, according to the available data) and Abstracts Views on Vision4Press platform.
Data correspond to usage on the plateform after 2015. The current usage metrics is available 48-96 hours after online publication and is updated daily on week days.
Initial download of the metrics may take a while.