Fig. 3
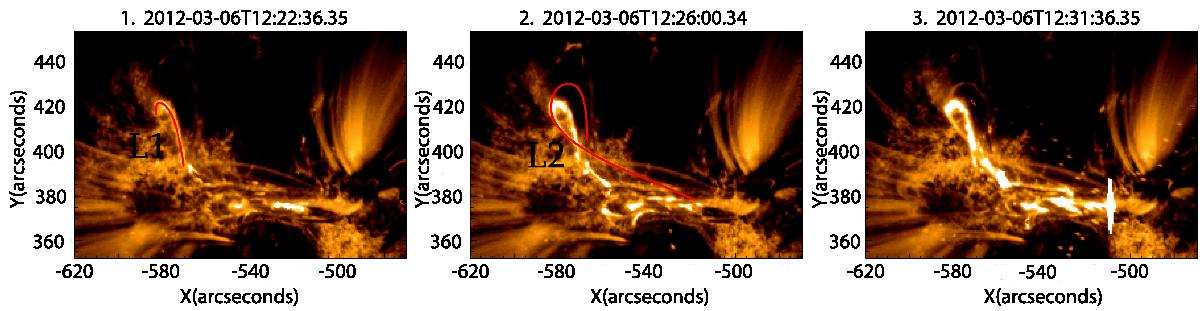
Time sequence of AIA/SDO 171Å images of the active region NOAA 11429 (time interval, 12 s; image scale, 0.6.̋per pixel). The location of the detected flare with respect to Heliographic coordinates (in degrees) is: −40, 21. Partial 171Å images during 12:22:36 UT–12:31:00 UT show the coronal loop appearance and the temporal evolution of the flare ascending phase. The red contour in panel 1 represents magnetic loop (L1). Panel 2 shows the L2 loop that appeared, and the last panel demonstrates the time when the L1 and L2 loops widened and the evident magnetic reconnection started between them.
Current usage metrics show cumulative count of Article Views (full-text article views including HTML views, PDF and ePub downloads, according to the available data) and Abstracts Views on Vision4Press platform.
Data correspond to usage on the plateform after 2015. The current usage metrics is available 48-96 hours after online publication and is updated daily on week days.
Initial download of the metrics may take a while.