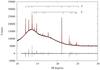
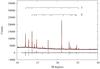
Fig. 1
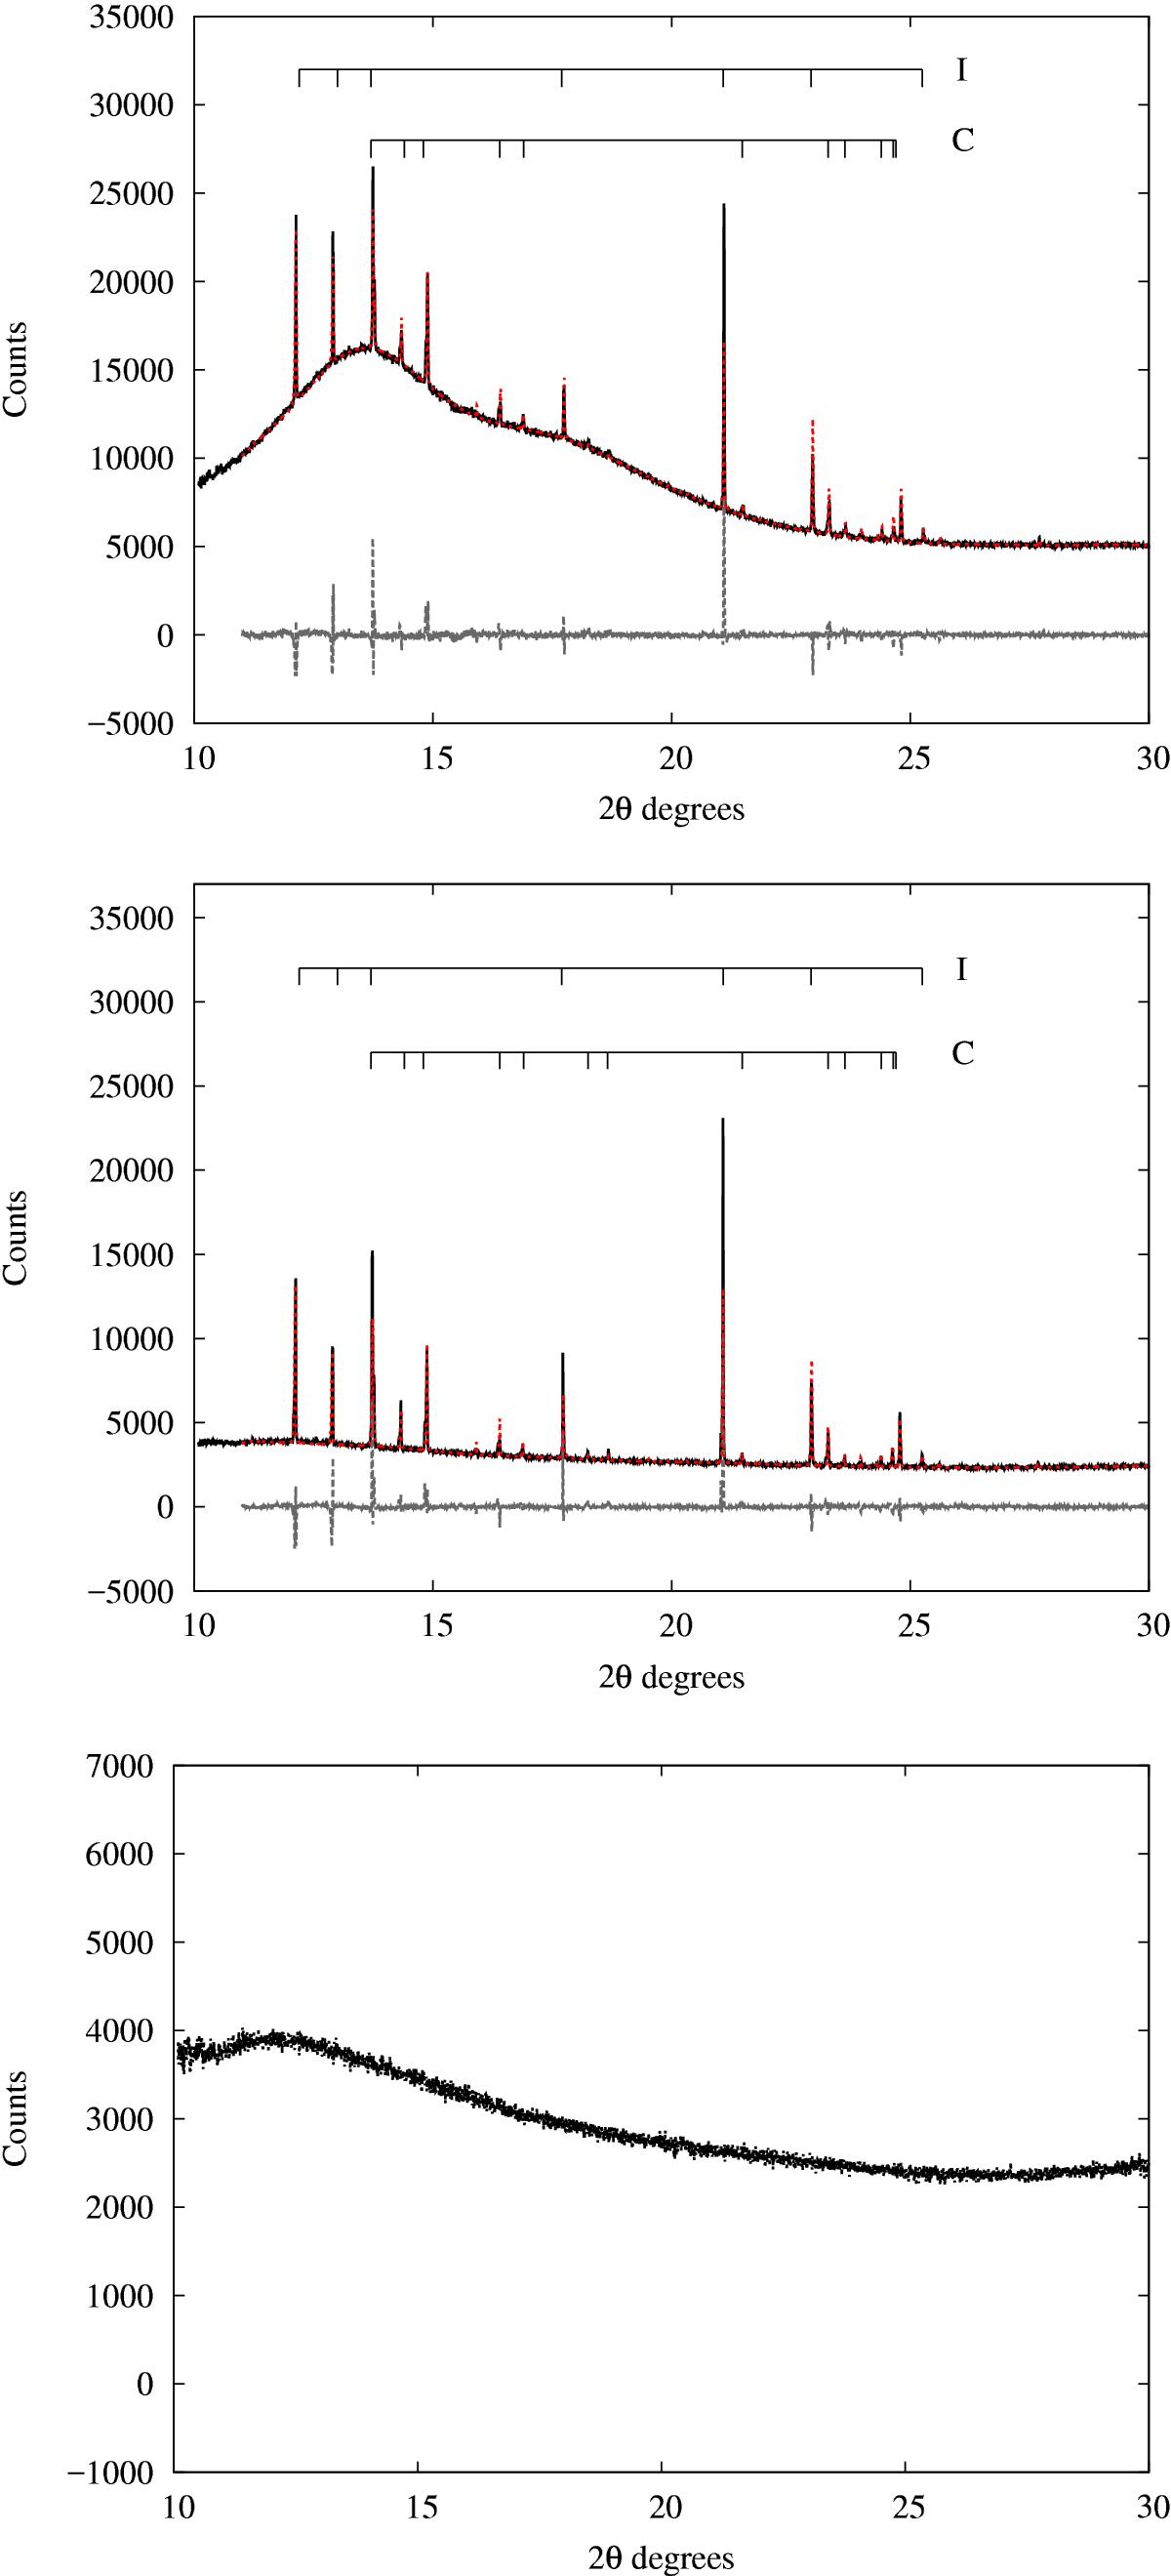
Rietveld refinements of the MS10.5 solution at a 10 bar CO2 pressure experimental data. From top-bottom: 90 K, 180 K, 245 K. The experimental data are shown in black, the calculated fit in red, and the residuals in grey below. All prominent peaks are labelled where C = clathrate peaks and I = hexagonal ice peaks. The larger residuals for some of the ice peaks are due to poor powder averaging due to the way the ice freezes inside the cell (preferred orientation) and the restricted cell rocking angle used to compensate for this during measurement.
Current usage metrics show cumulative count of Article Views (full-text article views including HTML views, PDF and ePub downloads, according to the available data) and Abstracts Views on Vision4Press platform.
Data correspond to usage on the plateform after 2015. The current usage metrics is available 48-96 hours after online publication and is updated daily on week days.
Initial download of the metrics may take a while.