Fig. 1
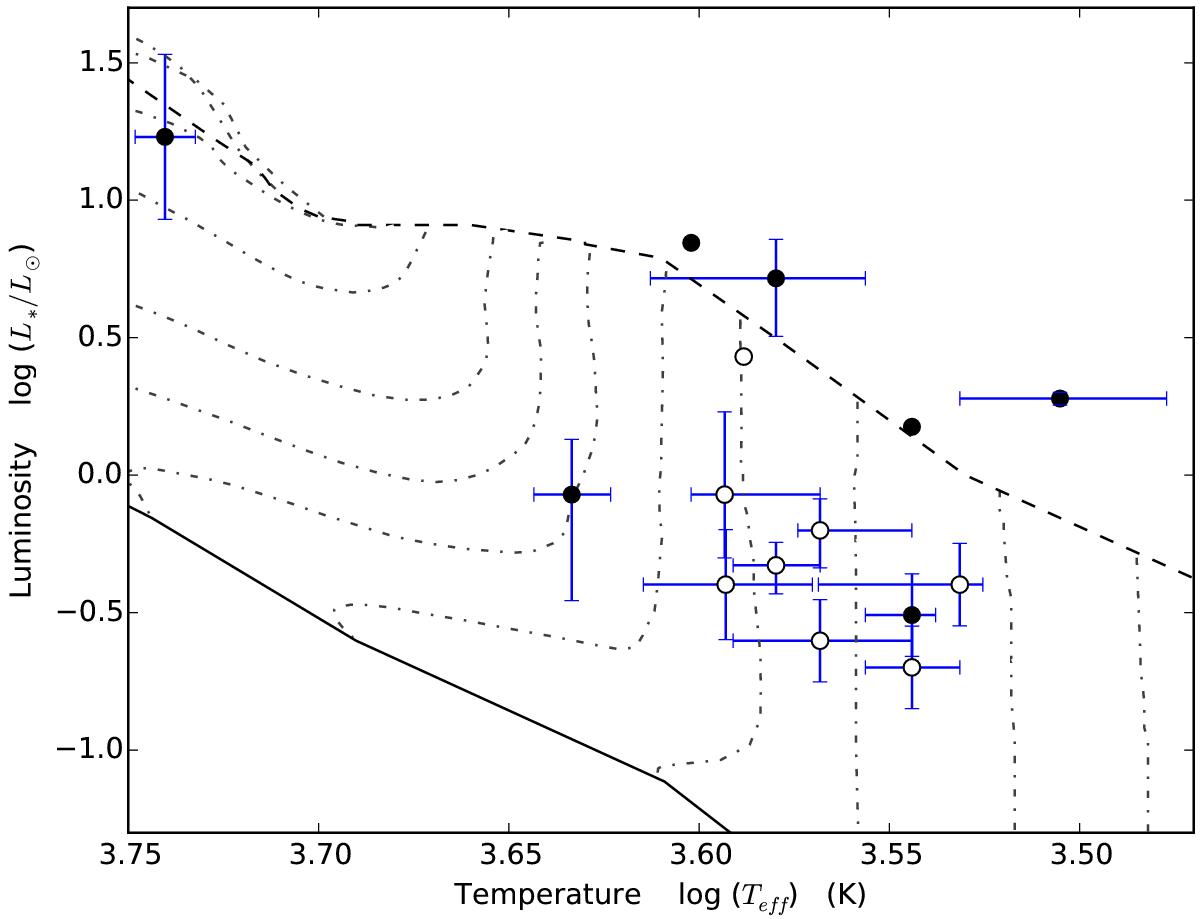
EXors in the HR diagram. Filled and open circles represent embedded and classical EXors, respectively. Each source is plotted according to its quiescent luminosity and effective temperature. The upper, heavy dashed curve is the stellar birthline of Palla & Stahler (1990), and the lower, heavy solid curve is the zero-age main sequence. The lighter dashed curves are the pre-main-sequence evolutionary tracks of Palla & Stahler (1999). From right to left, the corresponding stellar masses, in solar units, are: 0.1, 0.2, 0.4, 0.6, 0.8, 1.0, 1.2, 1.5, 2.0, 2.5, 3.0 and 3.5.
Current usage metrics show cumulative count of Article Views (full-text article views including HTML views, PDF and ePub downloads, according to the available data) and Abstracts Views on Vision4Press platform.
Data correspond to usage on the plateform after 2015. The current usage metrics is available 48-96 hours after online publication and is updated daily on week days.
Initial download of the metrics may take a while.