Free Access
Fig. 2
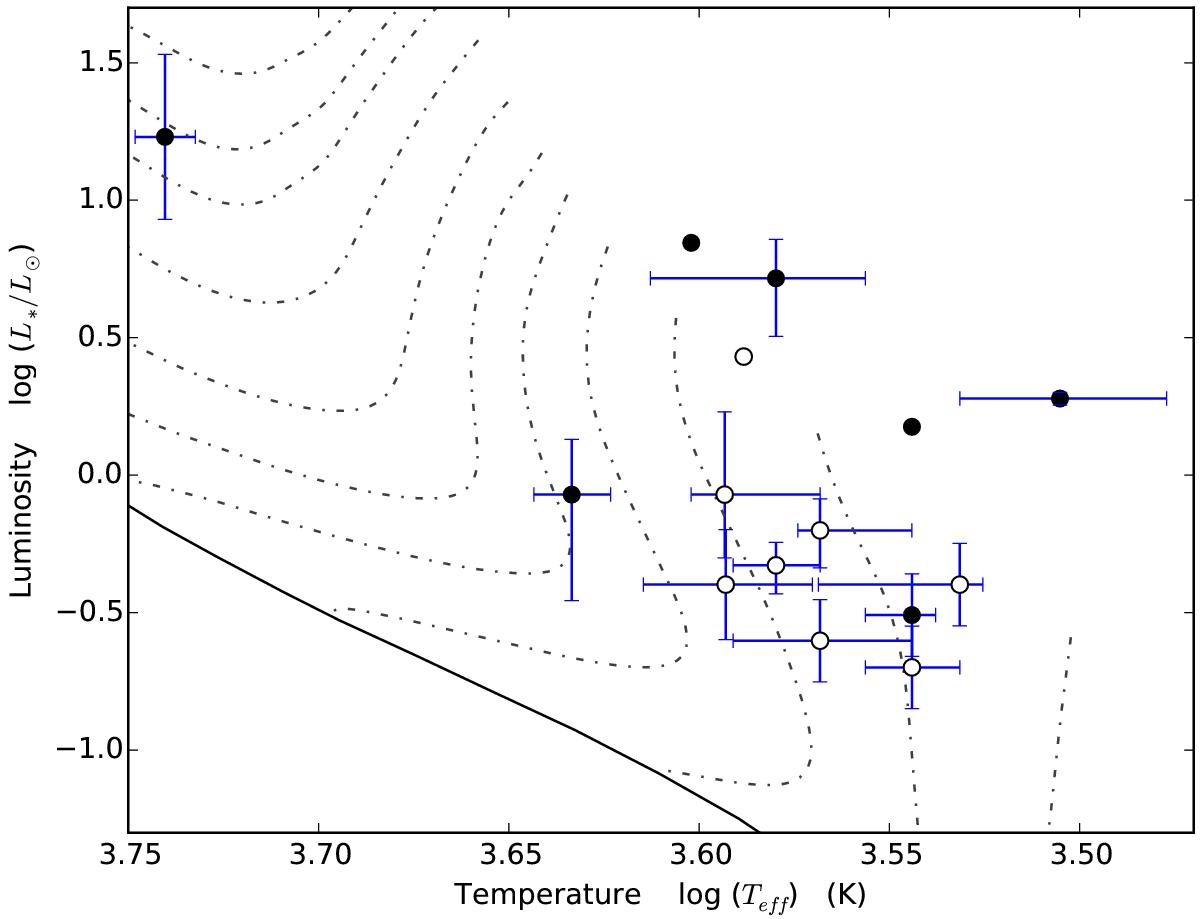
EXors in the HR diagram. All curves and symbols have the same meaning as in Fig. 1, but the pre-main-sequence evolutionary tracks of Tognelli et al. (2011) are shown instead. From right to left, the corresponding stellar masses, in solar units are: 0.20, 0.40, 0.60, 0.80, 1.0, 1.2, 1.5, 2.0, 2.6, 3.0 and 3.6.
Current usage metrics show cumulative count of Article Views (full-text article views including HTML views, PDF and ePub downloads, according to the available data) and Abstracts Views on Vision4Press platform.
Data correspond to usage on the plateform after 2015. The current usage metrics is available 48-96 hours after online publication and is updated daily on week days.
Initial download of the metrics may take a while.