Fig. 1
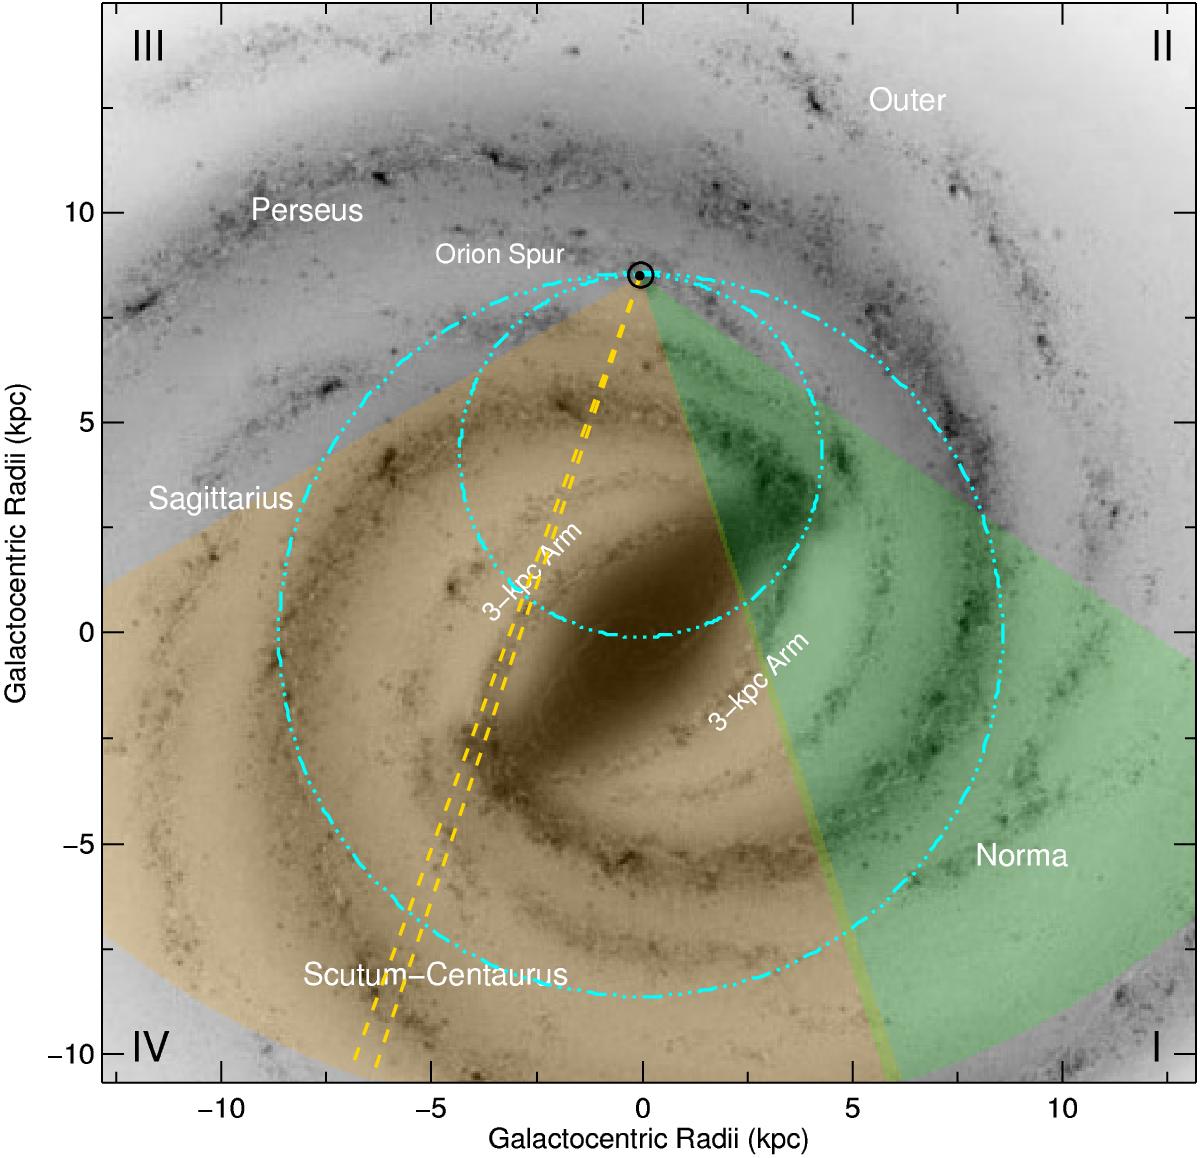
Coverage of the SEDIGISM and GRS surveys, shown respectively in orange and green shading, overlaid on the top down image of the Milky Way produced by Robert Hurt of the Spitzer Science Center in consultation with Robert Benjamin (see Churchwell et al. 2009, for more details). The large and small cyan circles indicate the Solar Circle and the position of the tangent points (maximum radial velocity), respectively, while the dashed yellow lines demarcate the region selected as the science demonstration field (see Sect. 2). The position of the Sun is indicated by the ⊙ symbol.
Current usage metrics show cumulative count of Article Views (full-text article views including HTML views, PDF and ePub downloads, according to the available data) and Abstracts Views on Vision4Press platform.
Data correspond to usage on the plateform after 2015. The current usage metrics is available 48-96 hours after online publication and is updated daily on week days.
Initial download of the metrics may take a while.