Fig. 10
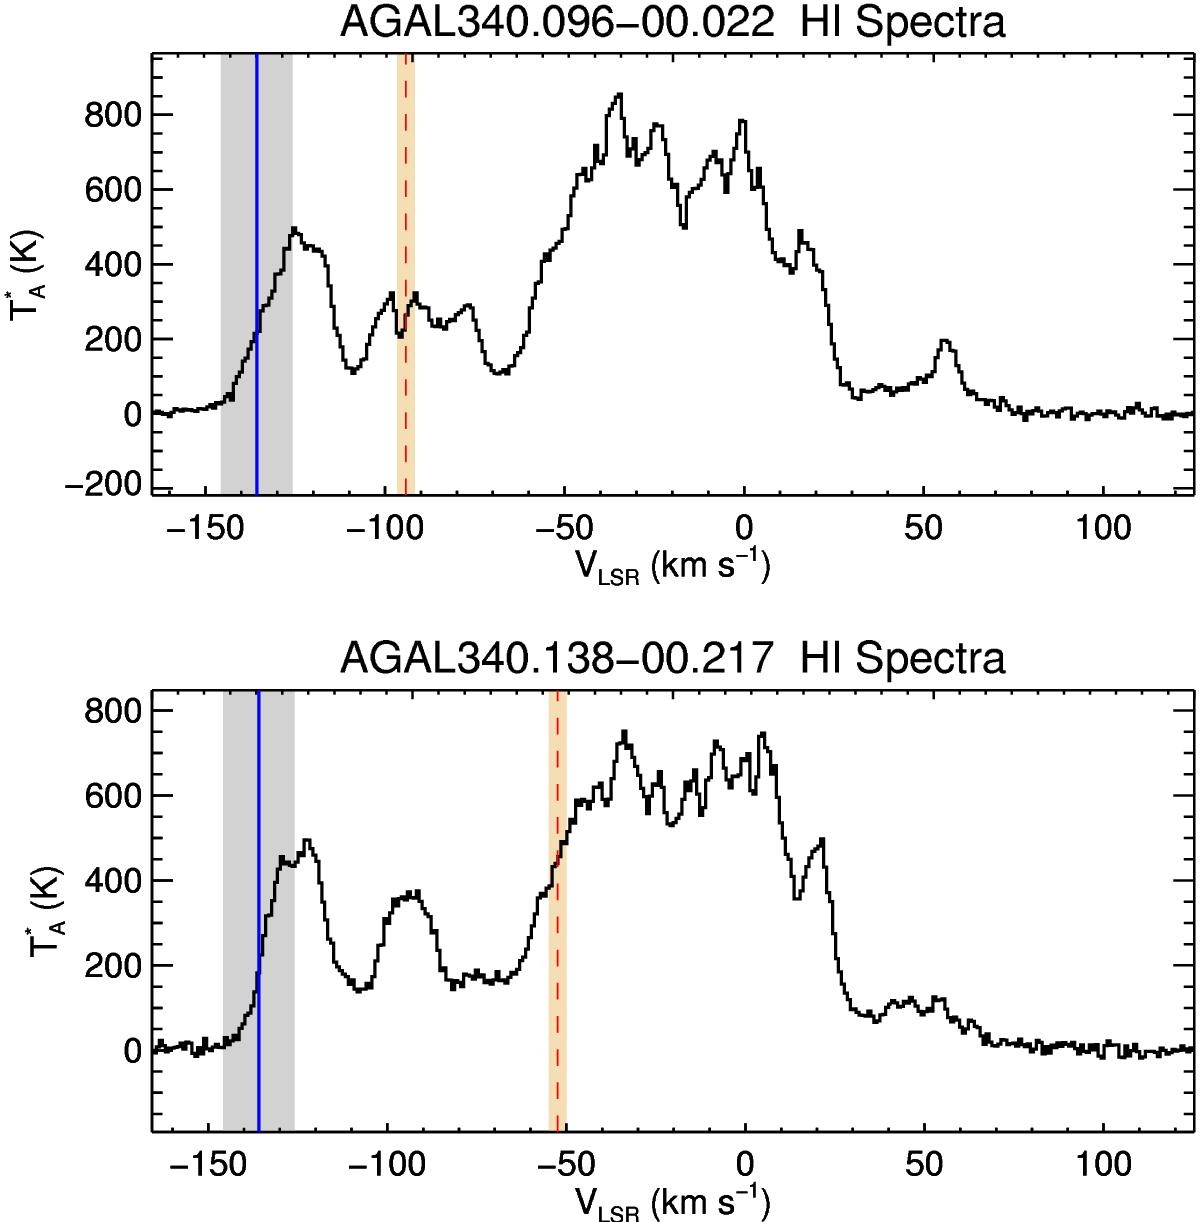
Example Hi spectra extracted towards dense clumps identified from the ATLASGAL survey. The velocity of the tangent position is determined from a fit to Hi data (e.g. McClure-Griffiths & Dickey 2007) and is indicated by the blue line; the grey shaded region covers a velocity range of ±10 km s-1. Sources in this region are placed at the distance of the tangent point. The dashed red vertical line shows the velocity of the source with the yellow shaded region showing the typical FWHM of the molecular lines. The top and bottom panels show examples of a source located at the near and far distances, respectively.
Current usage metrics show cumulative count of Article Views (full-text article views including HTML views, PDF and ePub downloads, according to the available data) and Abstracts Views on Vision4Press platform.
Data correspond to usage on the plateform after 2015. The current usage metrics is available 48-96 hours after online publication and is updated daily on week days.
Initial download of the metrics may take a while.