Fig. 11
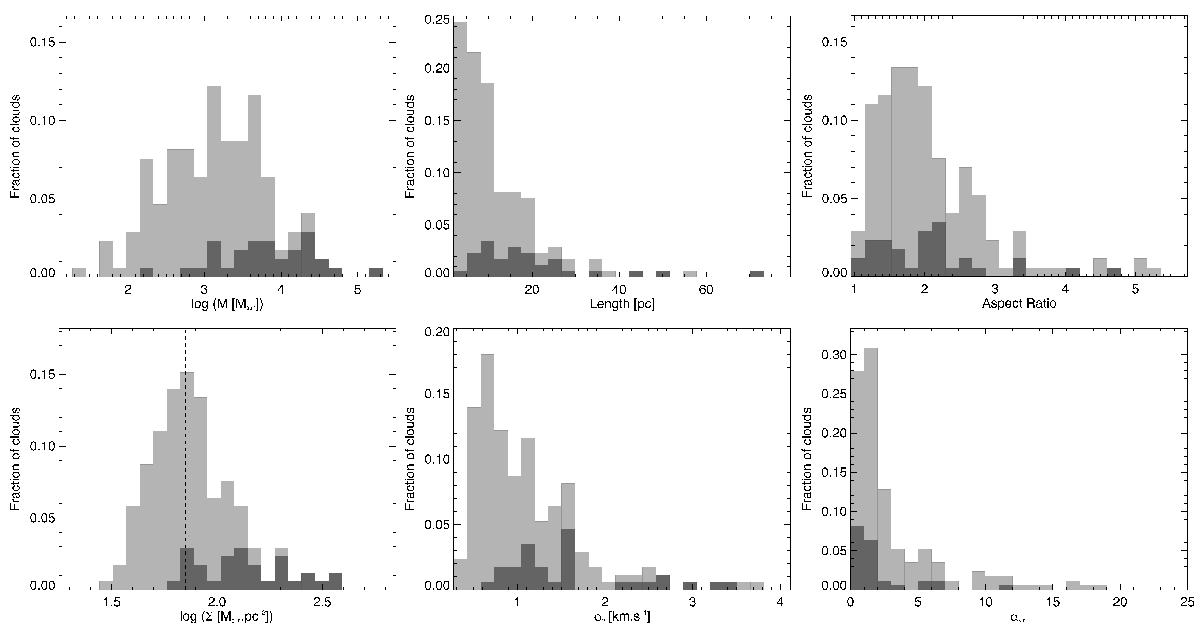
Properties of the GMCs within the science demonstration field: distributions of masses M (top-left), maximal lengths (top-centre), aspect ratios (top-right), average mass surface densities Σ (bottom-left), velocity dispersions σv (bottom-centre), and virial parameters αvir (bottom-right). The light-grey histograms show the distributions of properties for all clouds, excluding ten clouds with |vlsr| < 10 km s-1, as those have large distance uncertainties. The dark-grey histograms show the sub-sample of clouds that have an ATLASGAL match. The dashed vertical line on the average surface density plot shows our estimated completeness limit, ~70 M⊙ pc-2, corresponding to ~3 × 1021 cm-2.
Current usage metrics show cumulative count of Article Views (full-text article views including HTML views, PDF and ePub downloads, according to the available data) and Abstracts Views on Vision4Press platform.
Data correspond to usage on the plateform after 2015. The current usage metrics is available 48-96 hours after online publication and is updated daily on week days.
Initial download of the metrics may take a while.