Fig. 12
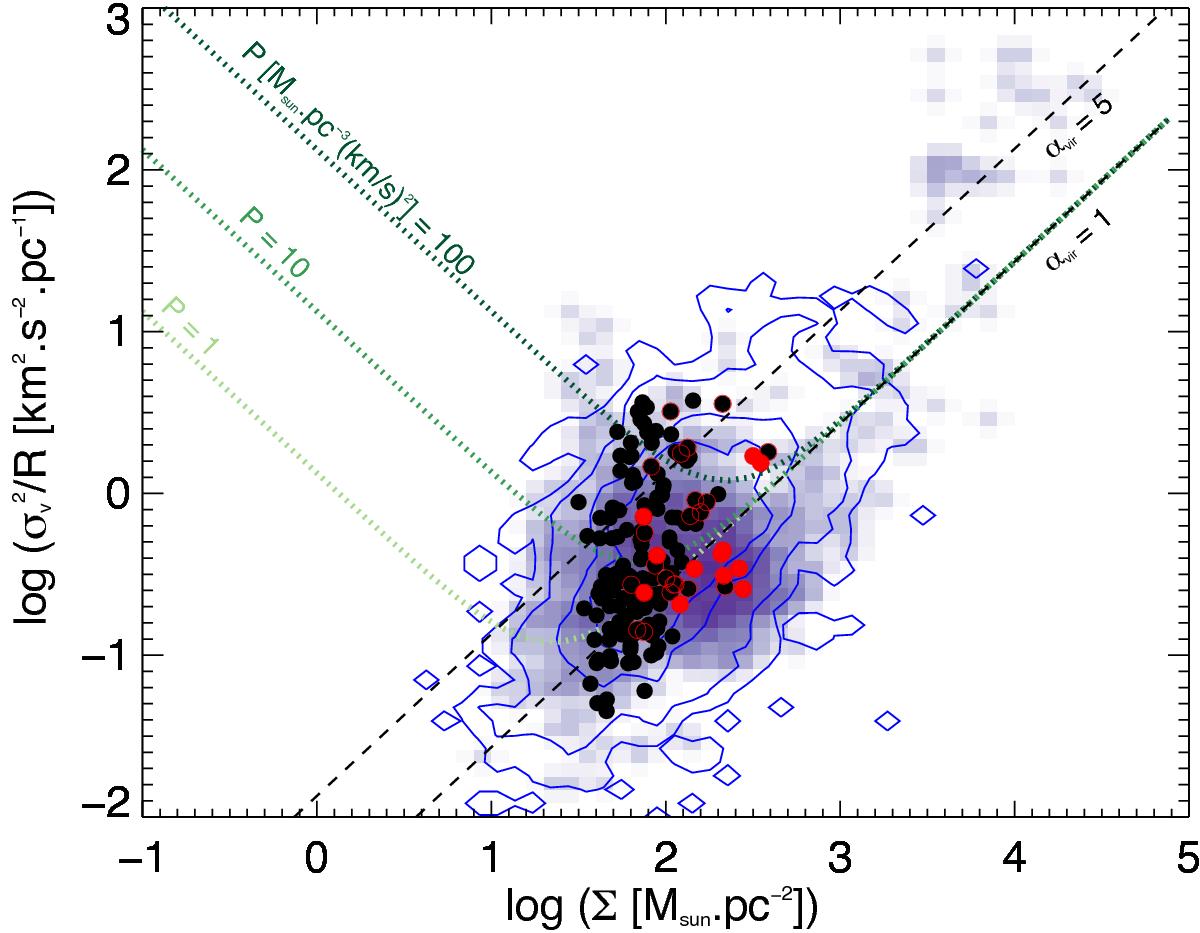
Characteristic size-linewidth coefficient (![]() ) as a function of average gas surface density Σ for all resolved GMCs extracted from the science demonstration field (black circles; those outlined in red highlight the clouds with an ATLASGAL counterpart, and the filled red circles correspond to clouds showing signs of high-mass star formation – see Sect. 5.3 for details). For comparison, the density of points in this plot from a compilation of extragalactic cloud samples (from Rosolowsky et al. 2003; Rosolowsky 2007; Bolatto et al. 2008; Santangelo et al. 2010; Wong et al. 2011; Wei et al. 2012; Colombo et al. 2014) and a compilation of Galactic cloud samples (from Heyer et al. 2009; Rathborne et al. 2009; Wang et al. 2009; Ginsburg et al. 2012; Giannetti et al. 2013; Battersby et al. 2014; Walker et al. 2015) are shown with blue contours, and with blue colour shading, respectively. The green dotted curves show the expected force balance between kinetic, gravitational and external pressure, for different values of external pressure, from P = 1 to 100 M⊙ pc-3 km2 s-2 (which corresponds to P/k ~ 5 × 10³–5 × 10⁵ K cm-3). The black-dashed lines correspond to αvir = 1 and αvir = 5.
) as a function of average gas surface density Σ for all resolved GMCs extracted from the science demonstration field (black circles; those outlined in red highlight the clouds with an ATLASGAL counterpart, and the filled red circles correspond to clouds showing signs of high-mass star formation – see Sect. 5.3 for details). For comparison, the density of points in this plot from a compilation of extragalactic cloud samples (from Rosolowsky et al. 2003; Rosolowsky 2007; Bolatto et al. 2008; Santangelo et al. 2010; Wong et al. 2011; Wei et al. 2012; Colombo et al. 2014) and a compilation of Galactic cloud samples (from Heyer et al. 2009; Rathborne et al. 2009; Wang et al. 2009; Ginsburg et al. 2012; Giannetti et al. 2013; Battersby et al. 2014; Walker et al. 2015) are shown with blue contours, and with blue colour shading, respectively. The green dotted curves show the expected force balance between kinetic, gravitational and external pressure, for different values of external pressure, from P = 1 to 100 M⊙ pc-3 km2 s-2 (which corresponds to P/k ~ 5 × 10³–5 × 10⁵ K cm-3). The black-dashed lines correspond to αvir = 1 and αvir = 5.
Current usage metrics show cumulative count of Article Views (full-text article views including HTML views, PDF and ePub downloads, according to the available data) and Abstracts Views on Vision4Press platform.
Data correspond to usage on the plateform after 2015. The current usage metrics is available 48-96 hours after online publication and is updated daily on week days.
Initial download of the metrics may take a while.