Fig. 13
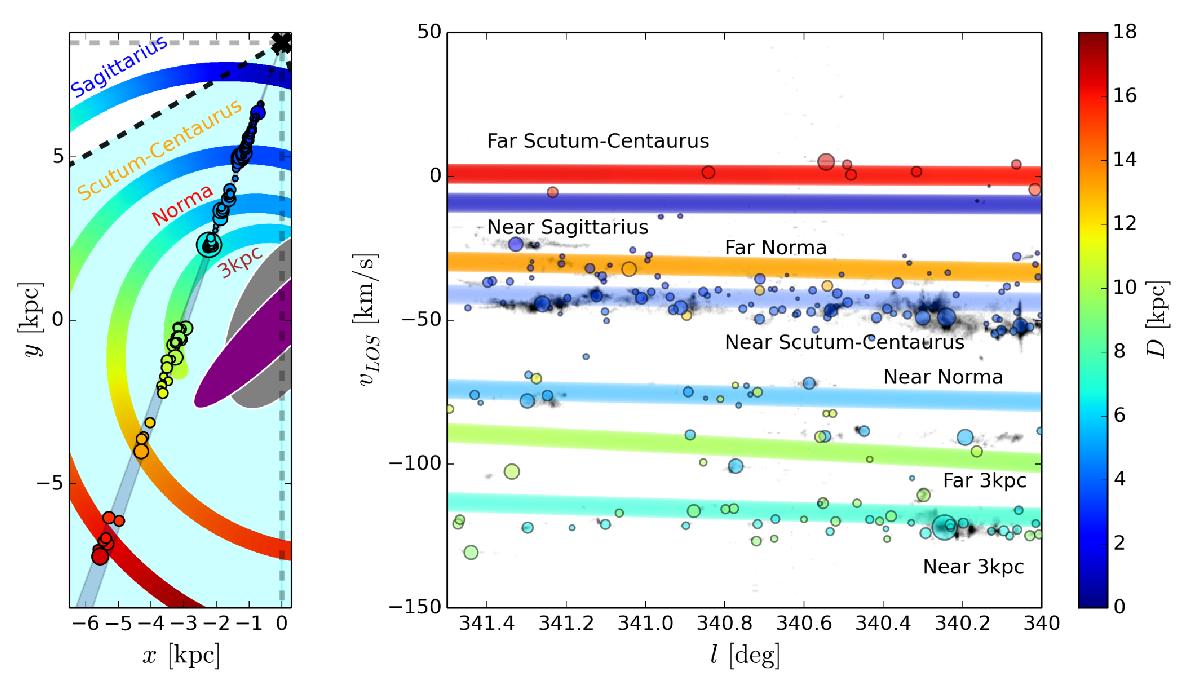
Left: top-down view of the Galaxy showing the SEDIGISM coverage (full survey in turquoise, and the science demonstration field as the small shaded line of sight). The different spiral arms from our model (see text for details) are shown and labelled with different colours. The positions of all the clouds in the science demonstration field are overplotted as coloured circles, whose colours indicate their assigned distances (see the colour bar to the right), and the size is proportional to the mass of the cloud. Right: lv plot of the peak intensity of 13CO in the science demonstration field (greyscale) overlaid with the positions of all the molecular clouds with assigned velocities (colours and sizes as in the left panel). The positions of the spiral arms are overplotted and labelled, also colour-coded with their distance.
Current usage metrics show cumulative count of Article Views (full-text article views including HTML views, PDF and ePub downloads, according to the available data) and Abstracts Views on Vision4Press platform.
Data correspond to usage on the plateform after 2015. The current usage metrics is available 48-96 hours after online publication and is updated daily on week days.
Initial download of the metrics may take a while.