Fig. 14
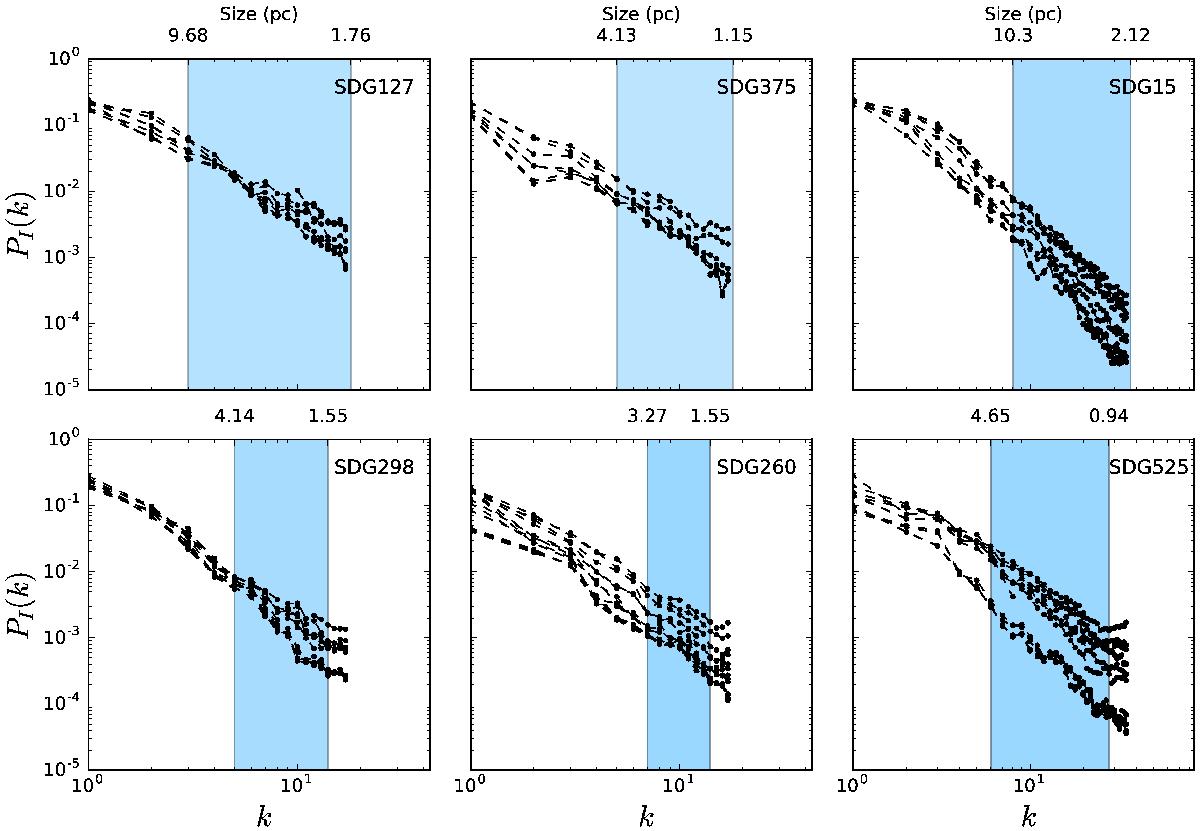
Normalised spatial power spectra for the six molecular clouds extracted with SCIMES with the highest numbers of leaves, for a range of velocity thickness ΔV: ineach panel, the different curves correspond to increasing thickness from top to bottom, with ΔV values in the range 0.5 to 18 km s-1. The blue area indicates the range of spatial scales over which a least square fitting of the spatial power index was performed. The scale on the lower X-axis gives the wave numbers (k), while that on the upper X-axis indicates the corresponding scale in pc, using the distance to each GMC, as listed in Table 2. Each panel is labelled with the ID of each GMC (as per Col. 1 in Table 2).
Current usage metrics show cumulative count of Article Views (full-text article views including HTML views, PDF and ePub downloads, according to the available data) and Abstracts Views on Vision4Press platform.
Data correspond to usage on the plateform after 2015. The current usage metrics is available 48-96 hours after online publication and is updated daily on week days.
Initial download of the metrics may take a while.