Fig. 15
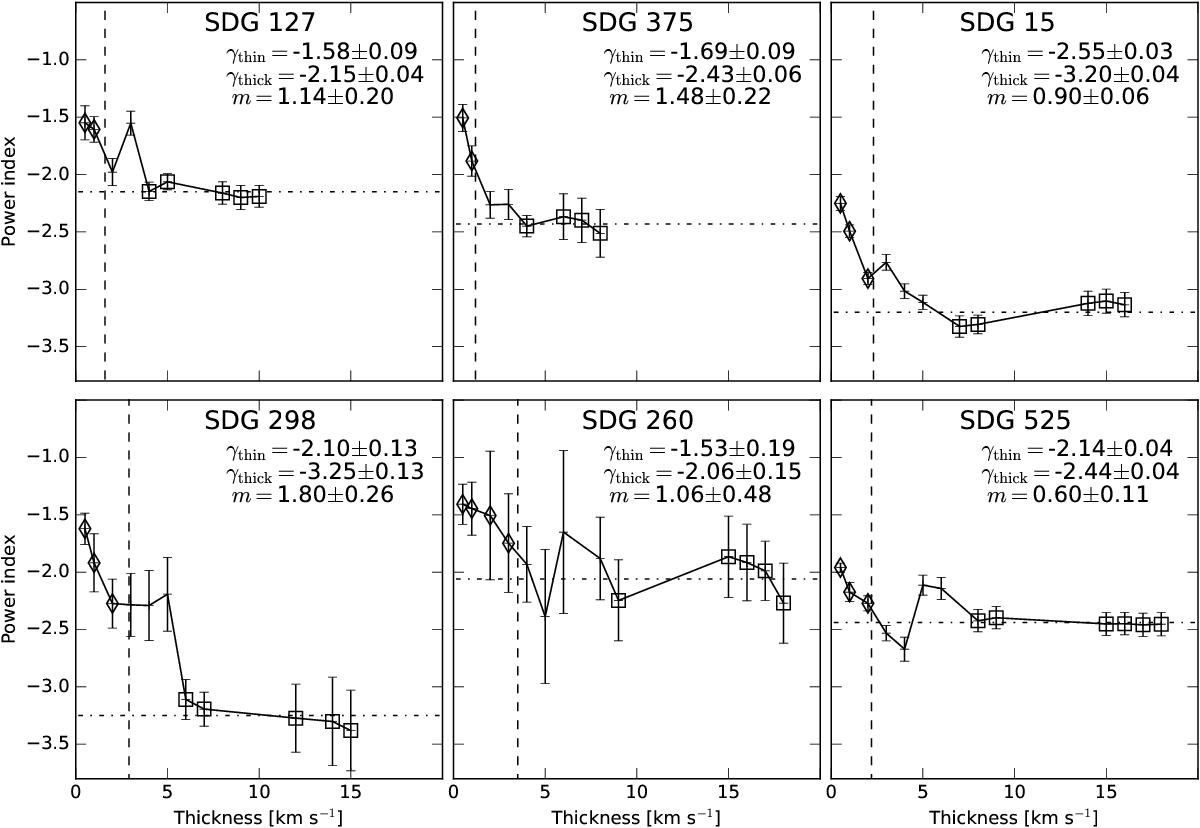
Variations in the power spectrum indices with velocity thickness for the different GMCs. The error bars correspond to the 1σ statistical uncertainties on the fit. The dotted horizontal lines indicate the saturation index for each GMC, corresponding to the thick regime where density fluctuations dominate. The dashed vertical lines show the respective velocity dispersion, σV, for each GMC. The data points used to compute the thin and thick indices (γthin and γthick), are indicated with diamonds and square symbols, respectively. These values, as well as the index of the second order structure function (m), are indicated in each panel (see text for details).
Current usage metrics show cumulative count of Article Views (full-text article views including HTML views, PDF and ePub downloads, according to the available data) and Abstracts Views on Vision4Press platform.
Data correspond to usage on the plateform after 2015. The current usage metrics is available 48-96 hours after online publication and is updated daily on week days.
Initial download of the metrics may take a while.