Fig. 17
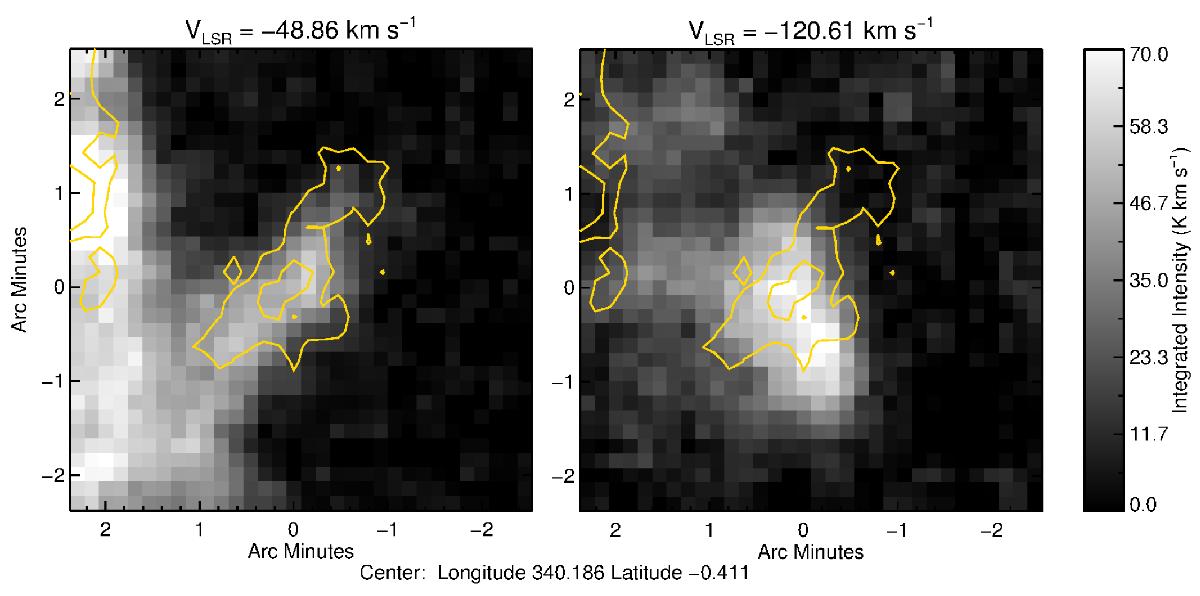
Integrated 13CO maps of the two components seen towards AGAL340.188-00.411 (see lower panel of Fig. 16). The emission has been integrated over a velocity range of twice the FWHM line width of each component. The yellow contours show the distribution of the 870 μm emission mapped by ATLASGAL. In this case, there is a better morphological correlation between the dust emission and the CO emission found at −48.9 km s-1 than with the CO emission at −120.6 km s-1. Therefore, we assigned a velocity of −48.9 km s-1 to this clump.
Current usage metrics show cumulative count of Article Views (full-text article views including HTML views, PDF and ePub downloads, according to the available data) and Abstracts Views on Vision4Press platform.
Data correspond to usage on the plateform after 2015. The current usage metrics is available 48-96 hours after online publication and is updated daily on week days.
Initial download of the metrics may take a while.