Fig. 18
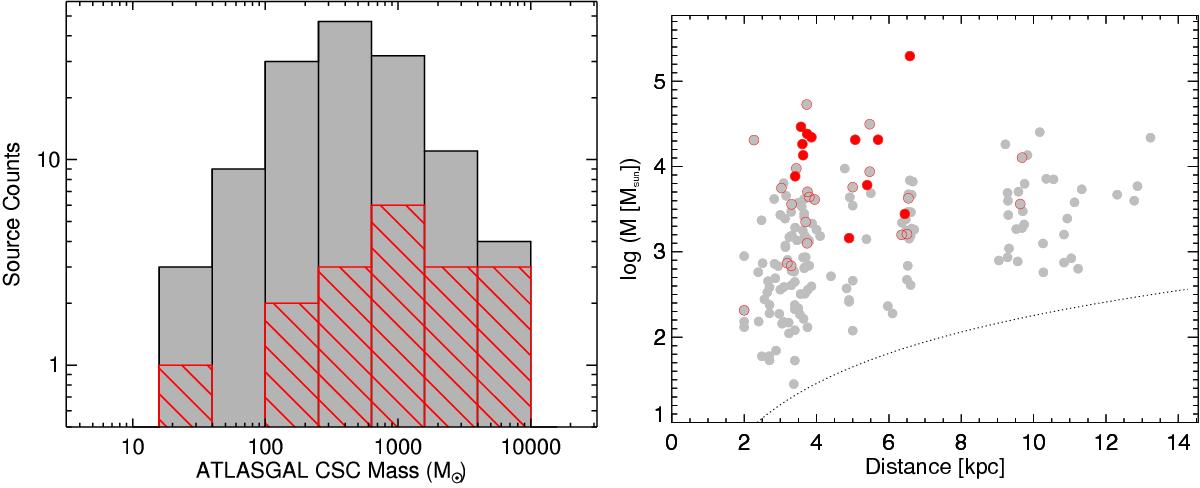
Left: mass distribution of all ATLASGAL clumps located in the science demonstration field with assigned distances. The mass distribution of clumps associated with a high-mass star formation tracer is shown in red hatching. The bin size is 0.4 dex. Right: mass-distance distribution of all SEDIGISM clouds. Clouds associated with ATLASGAL and with an HMSF tracer are shown in red-filled circles, while the non-HMSF clouds are shown as grey circles (out of which those with an ATLASGAL match are red-outlined). The dotted black line indicates the 13CO(2−1) mass sensitivity limit for an unresolved source (i.e. 28′′ radius).
Current usage metrics show cumulative count of Article Views (full-text article views including HTML views, PDF and ePub downloads, according to the available data) and Abstracts Views on Vision4Press platform.
Data correspond to usage on the plateform after 2015. The current usage metrics is available 48-96 hours after online publication and is updated daily on week days.
Initial download of the metrics may take a while.