Fig. 20
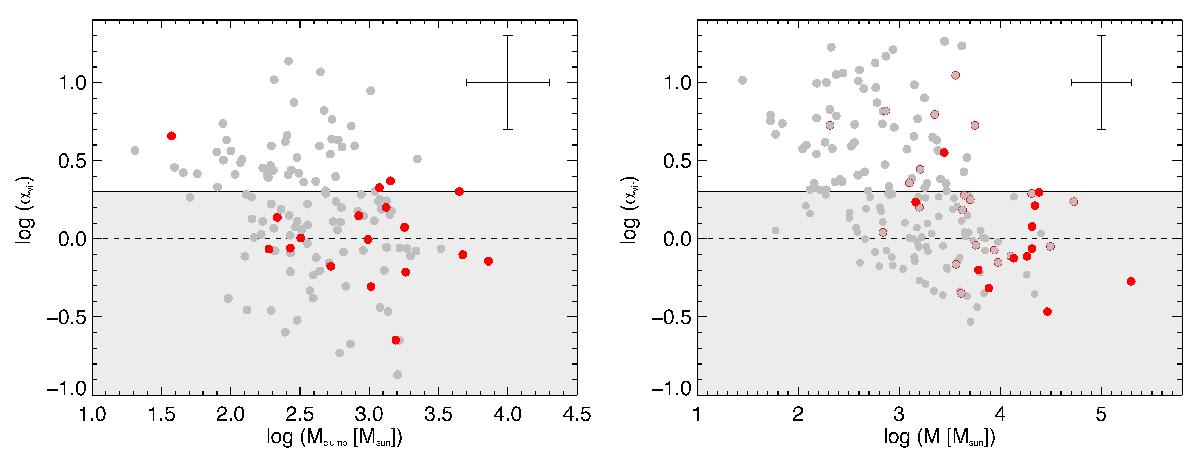
Virial parameter (αvir) as a function of clump mass (Mclump) in the left panel, and cloud mass (M) in the right panel. This is shown for the HMSF and non-HMSF sub-samples; these are indicated as red and grey circles, respectively. In the right panel, GMCs with an ATLASGAL match but no HMSF tracer are shown as grey circles with a red outline. The solid horizontal line indicates the critical value of αvir = 2, for an isothermal sphere in hydrostatic equilibrium without magnetic support. The dashed black line indicates an αvir = 1. The light grey shading indicates the region where clouds are unstable and likely to be collapsing without additional support from a strong magnetic field. Representative error bars, corresponding to a factor two uncertainty, are shown in the upper-right corner of each panel.
Current usage metrics show cumulative count of Article Views (full-text article views including HTML views, PDF and ePub downloads, according to the available data) and Abstracts Views on Vision4Press platform.
Data correspond to usage on the plateform after 2015. The current usage metrics is available 48-96 hours after online publication and is updated daily on week days.
Initial download of the metrics may take a while.