Fig. 21
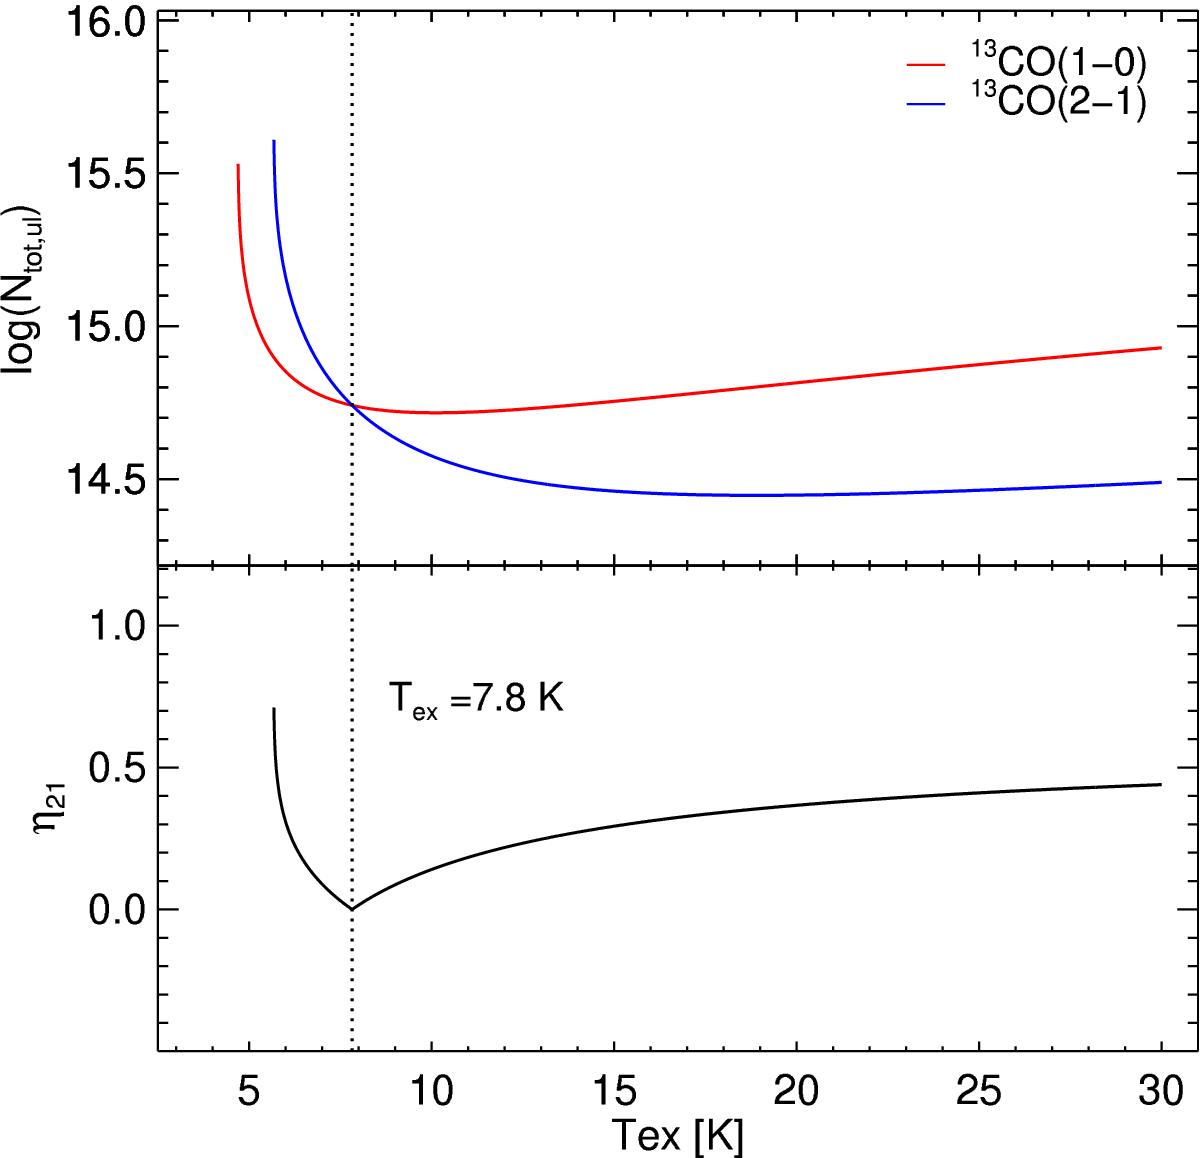
Top: total 13CO column density as estimated over a range of Tex from each line transition separately using Eq. (4). Bottom: distribution of η21 (Eq. (6)) over the same range of Tex. Since we have defined η21 as the absolute difference between the two total column density estimates, the Tex in this voxel is determined by locating the global minimum, as shown by the vertical dotted black line. For this example voxel, we find Tex = 7.8 K.
Current usage metrics show cumulative count of Article Views (full-text article views including HTML views, PDF and ePub downloads, according to the available data) and Abstracts Views on Vision4Press platform.
Data correspond to usage on the plateform after 2015. The current usage metrics is available 48-96 hours after online publication and is updated daily on week days.
Initial download of the metrics may take a while.