Fig. 25
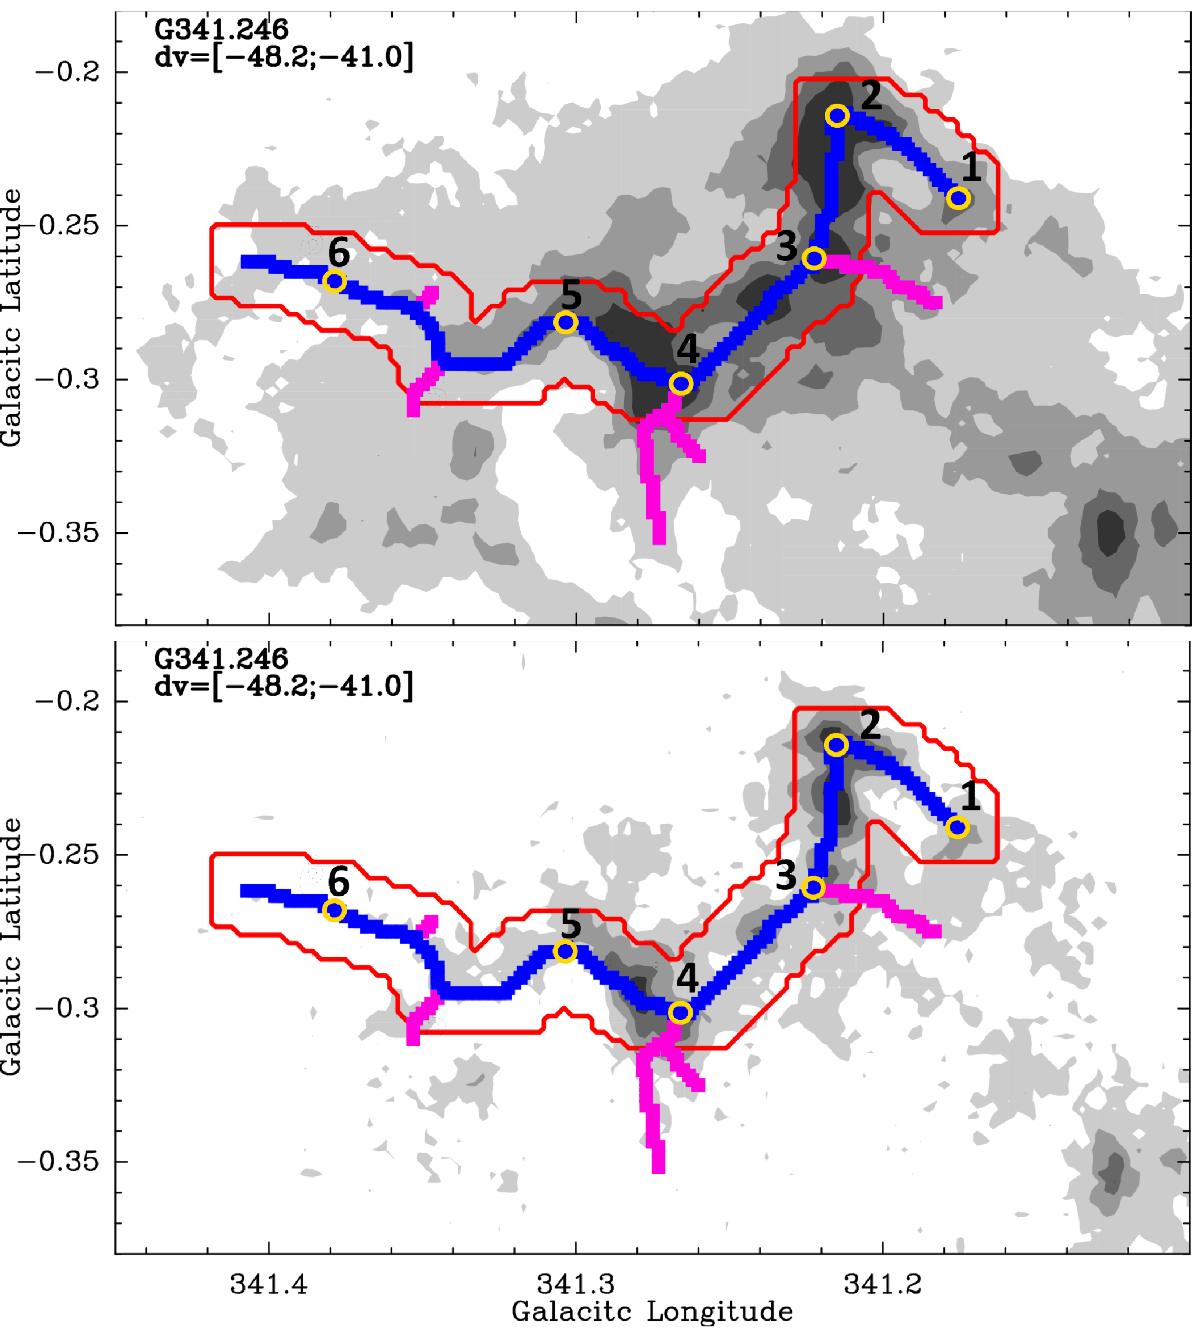
Integrated intensity map of the 13CO(2−1) (top) and C18O(2−1) (bottom) transitions towards G341.246–0.267 in the velocity range of [−48.2,−41.0] km s-1. Grey levels are from 10-σ (9.4 K km s-1) for 13CO in steps of 10-σ, and from 5-σ (4.7 K km s-1) for C18O in steps of 5-σ. The blue solid line marks the main spine of the filament identified; the magenta lines mark the other sub-branches identified on the ATLASGAL dust emission map by Li et al. (2016). The yellow empty circles mark the positions where the six spectra shown in Fig. 26 are extracted. The red thin line marks the dilation box used to compute the length and the mass of the filament.
Current usage metrics show cumulative count of Article Views (full-text article views including HTML views, PDF and ePub downloads, according to the available data) and Abstracts Views on Vision4Press platform.
Data correspond to usage on the plateform after 2015. The current usage metrics is available 48-96 hours after online publication and is updated daily on week days.
Initial download of the metrics may take a while.