Free Access
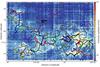
Fig. 27
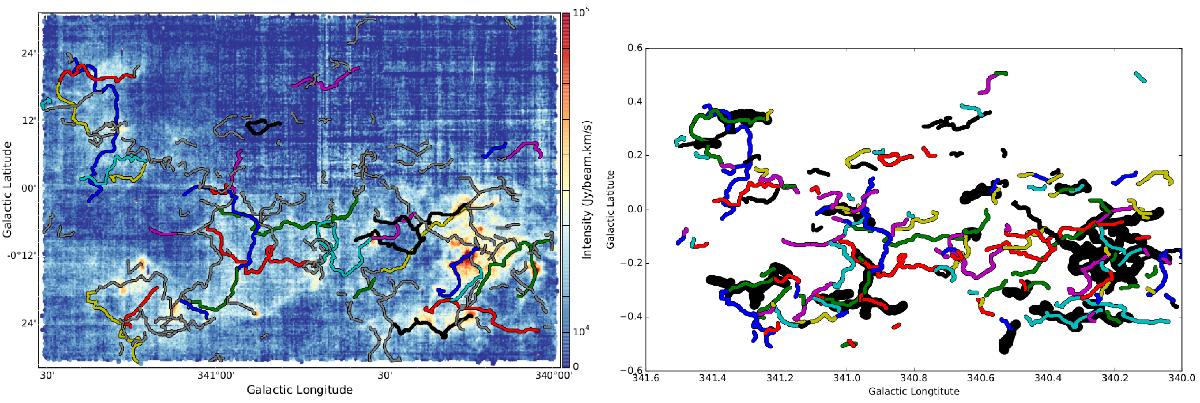
Left: spines of the 145 DisPerSE filaments overlaid on the 13CO integrated intensity map. The coloured lines correspond to the sub-sample of 33 filaments listed in Table B.1. Right: comparison between the ATLASGAL filaments (thick black lines) and the spines of the 145 DisPerSE structures (thin coloured lines).
This figure is made of several images, please see below:
Current usage metrics show cumulative count of Article Views (full-text article views including HTML views, PDF and ePub downloads, according to the available data) and Abstracts Views on Vision4Press platform.
Data correspond to usage on the plateform after 2015. The current usage metrics is available 48-96 hours after online publication and is updated daily on week days.
Initial download of the metrics may take a while.