Fig. 3
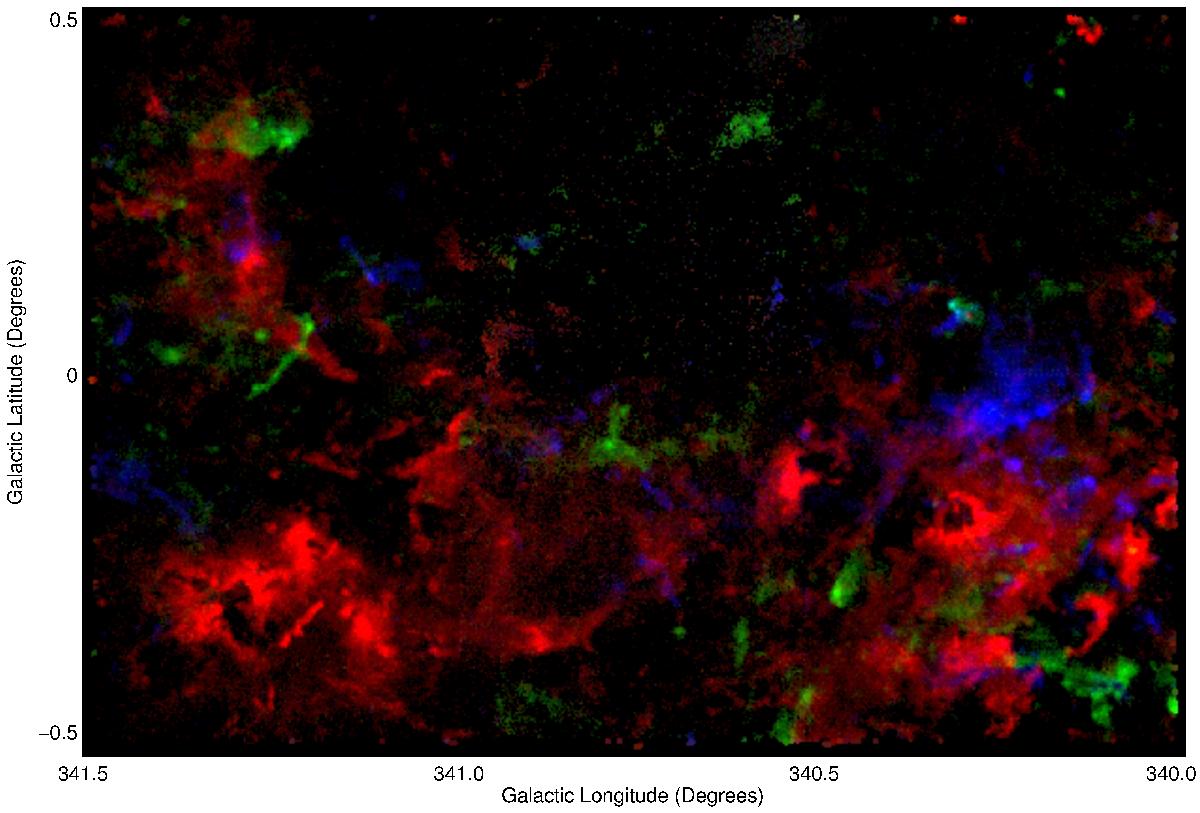
Three-colour peak 13CO emission map of the science demonstration field. The velocity ranges used to produce the blue, green and red images are −130 to −110 km s-1, −110 to −60 km s-1 and −60 to +5 km s-1, respectively. The emission in these velocity ranges is dominated by the near-sides of the 3 kpc, Norma and Scutum-Centaurus arms, respectively.
Current usage metrics show cumulative count of Article Views (full-text article views including HTML views, PDF and ePub downloads, according to the available data) and Abstracts Views on Vision4Press platform.
Data correspond to usage on the plateform after 2015. The current usage metrics is available 48-96 hours after online publication and is updated daily on week days.
Initial download of the metrics may take a while.