Fig. 4
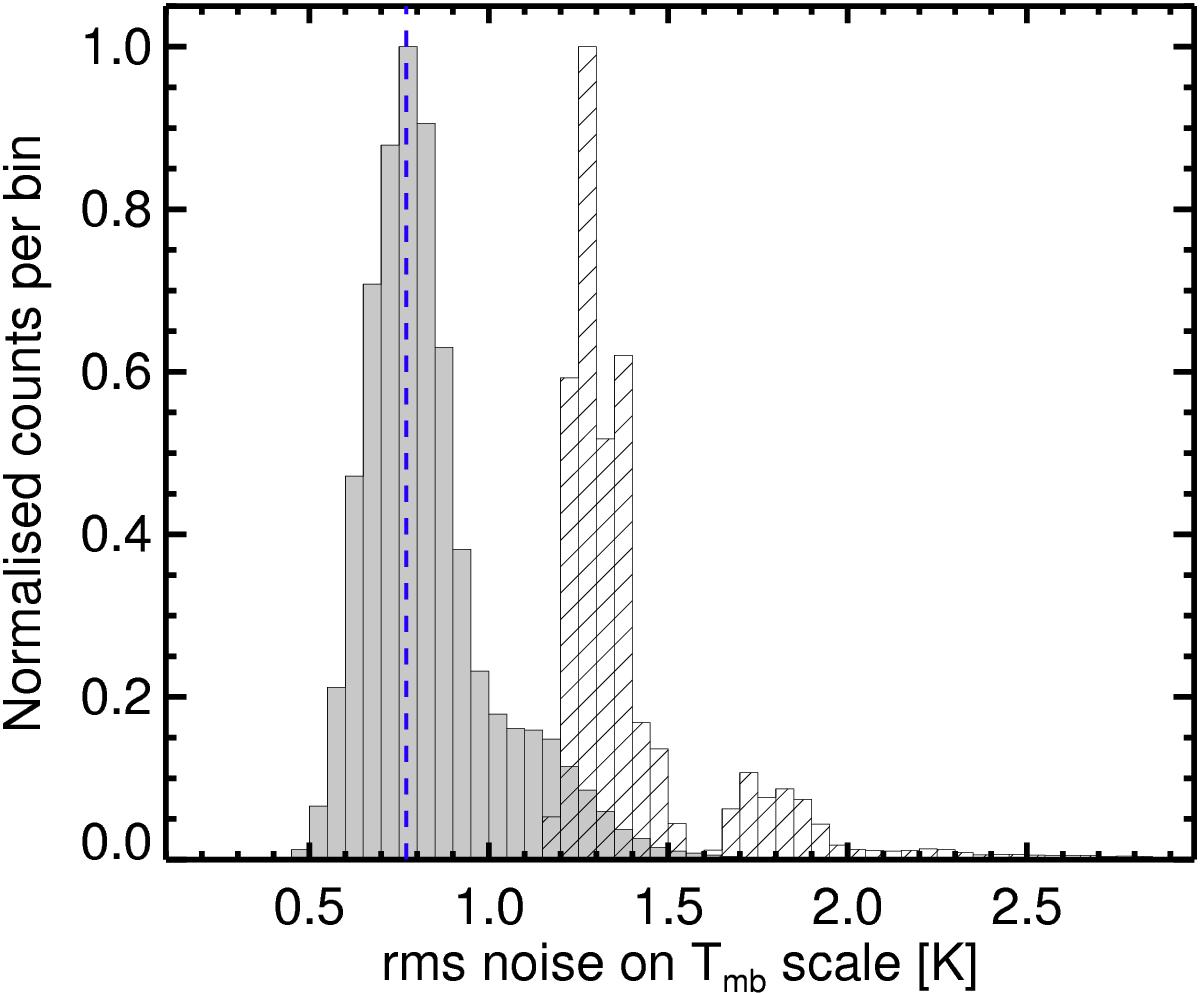
Distribution of rms noise values for the science demonstration field on Tmb scale. The filled grey histogram shows the noise in the final, combined data; the hatched histogram shows the noise measured in the individual scans that were combined for the final data cube. The distribution peaks at 0.78 K, as indicated by the blue dashed line. Both distributions have been normalised to a peak value of 1.
Current usage metrics show cumulative count of Article Views (full-text article views including HTML views, PDF and ePub downloads, according to the available data) and Abstracts Views on Vision4Press platform.
Data correspond to usage on the plateform after 2015. The current usage metrics is available 48-96 hours after online publication and is updated daily on week days.
Initial download of the metrics may take a while.