Free Access
Fig. 8
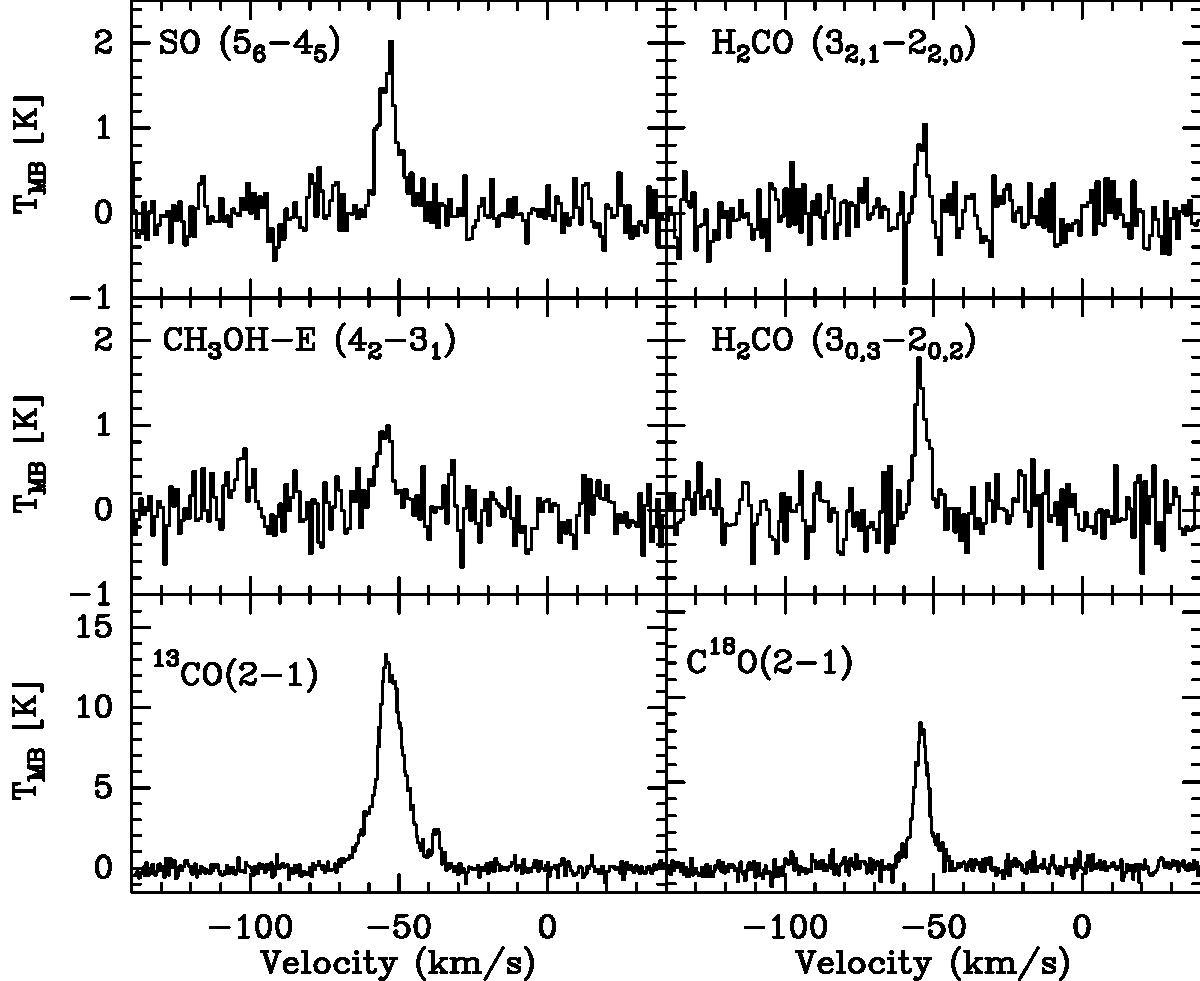
Spectra extracted around the lines of SO, H2CO, CH3OH, 13CO and C18O towards AGAL340.054−00.244, which is the brightest ATLASGAL clump in the field. The emission has been integrated within a radius of 15′′ around the peak position of the dust clump.
Current usage metrics show cumulative count of Article Views (full-text article views including HTML views, PDF and ePub downloads, according to the available data) and Abstracts Views on Vision4Press platform.
Data correspond to usage on the plateform after 2015. The current usage metrics is available 48-96 hours after online publication and is updated daily on week days.
Initial download of the metrics may take a while.