Fig. 1
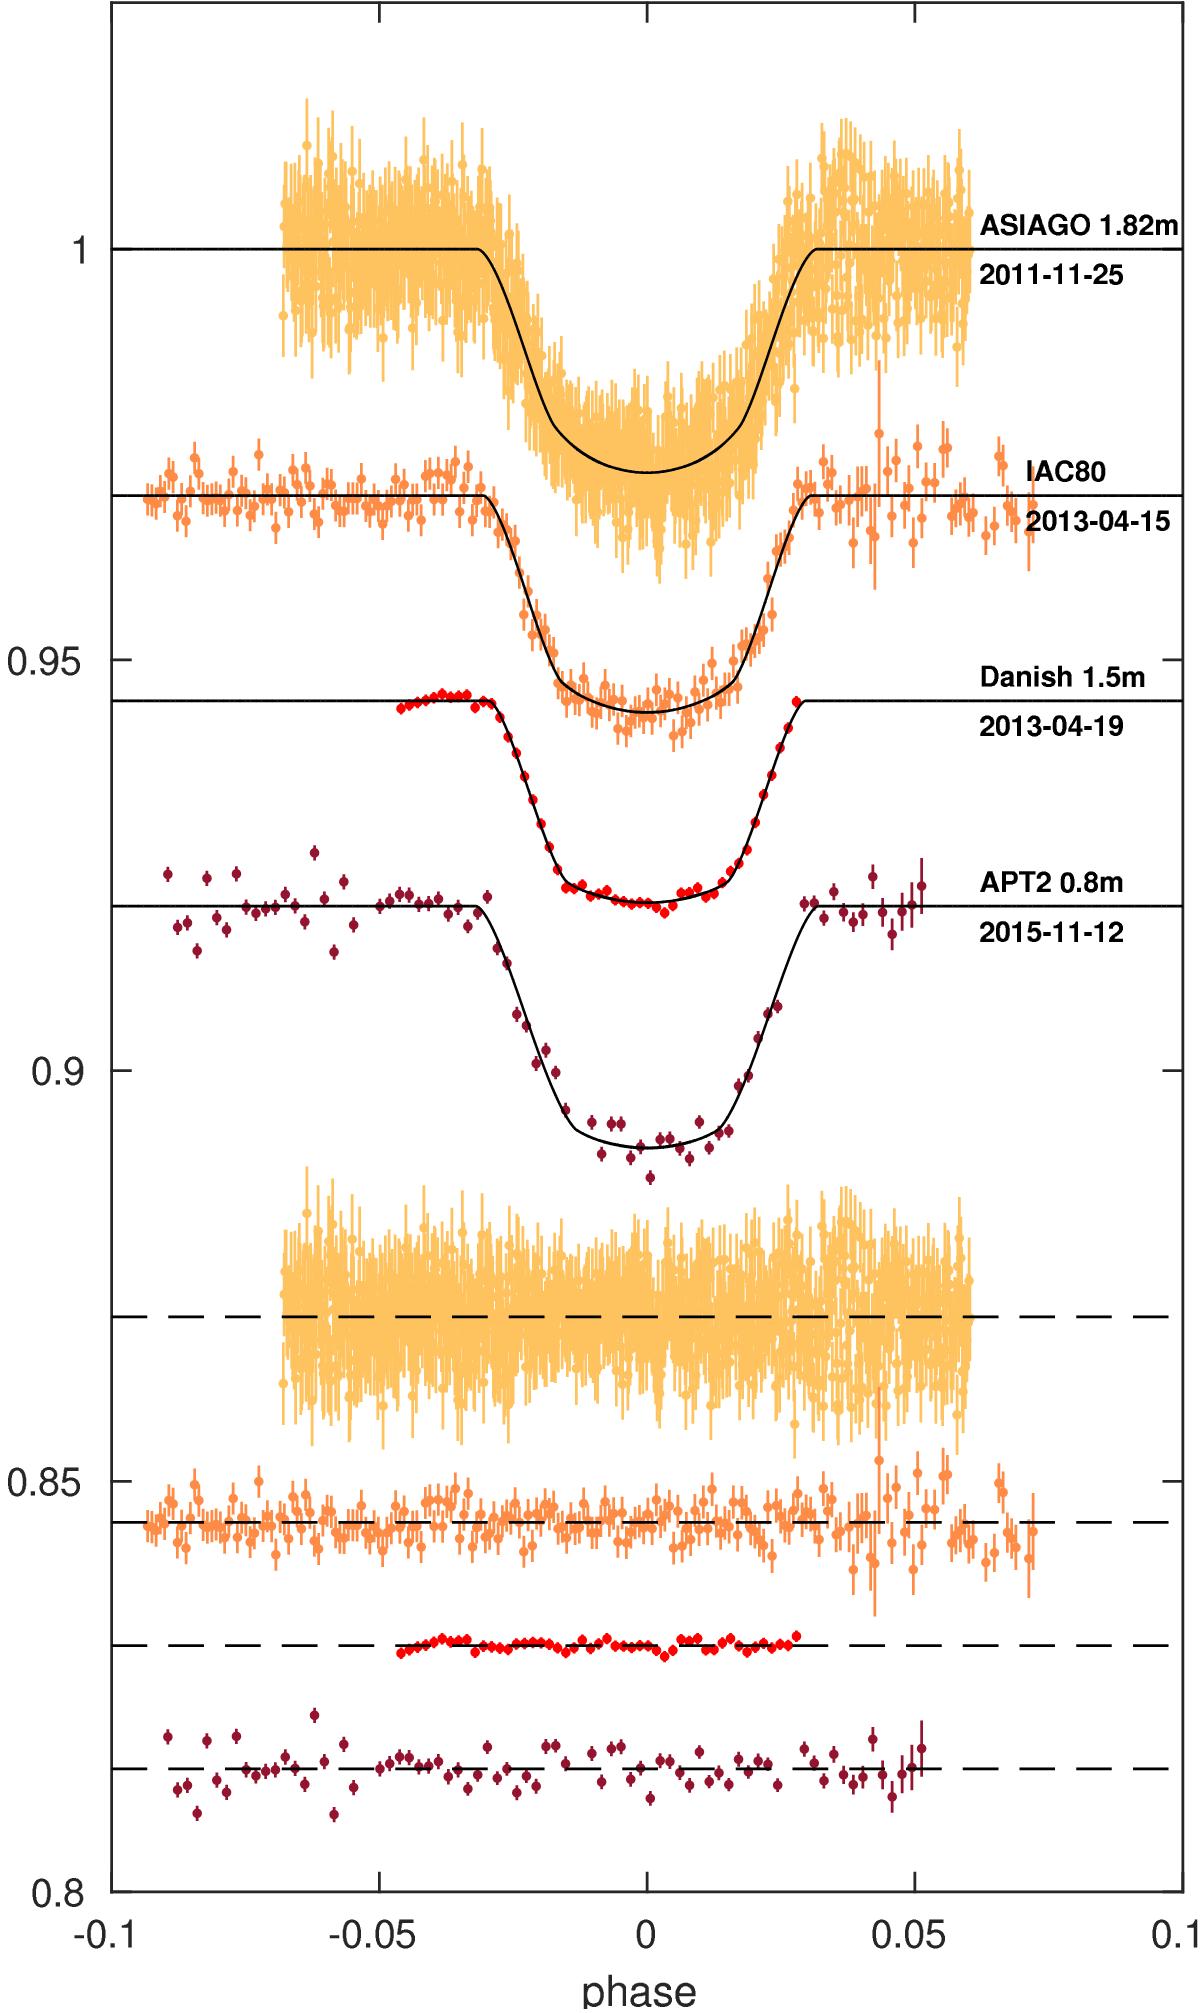
WASP-43 normalized light curves with best-fit models superimposed. For clarity a vertical offset was applied to the different LCs. The lower part of the diagram shows the best-fit residuals. Data are phase-folded according to the orbital period reported in Table 4 and the epochs of mid-transit reported in Table 3 . For each LC we report the telescope and the date of observation. In all cases a Johnson R filter was used.
Current usage metrics show cumulative count of Article Views (full-text article views including HTML views, PDF and ePub downloads, according to the available data) and Abstracts Views on Vision4Press platform.
Data correspond to usage on the plateform after 2015. The current usage metrics is available 48-96 hours after online publication and is updated daily on week days.
Initial download of the metrics may take a while.