Fig. 2
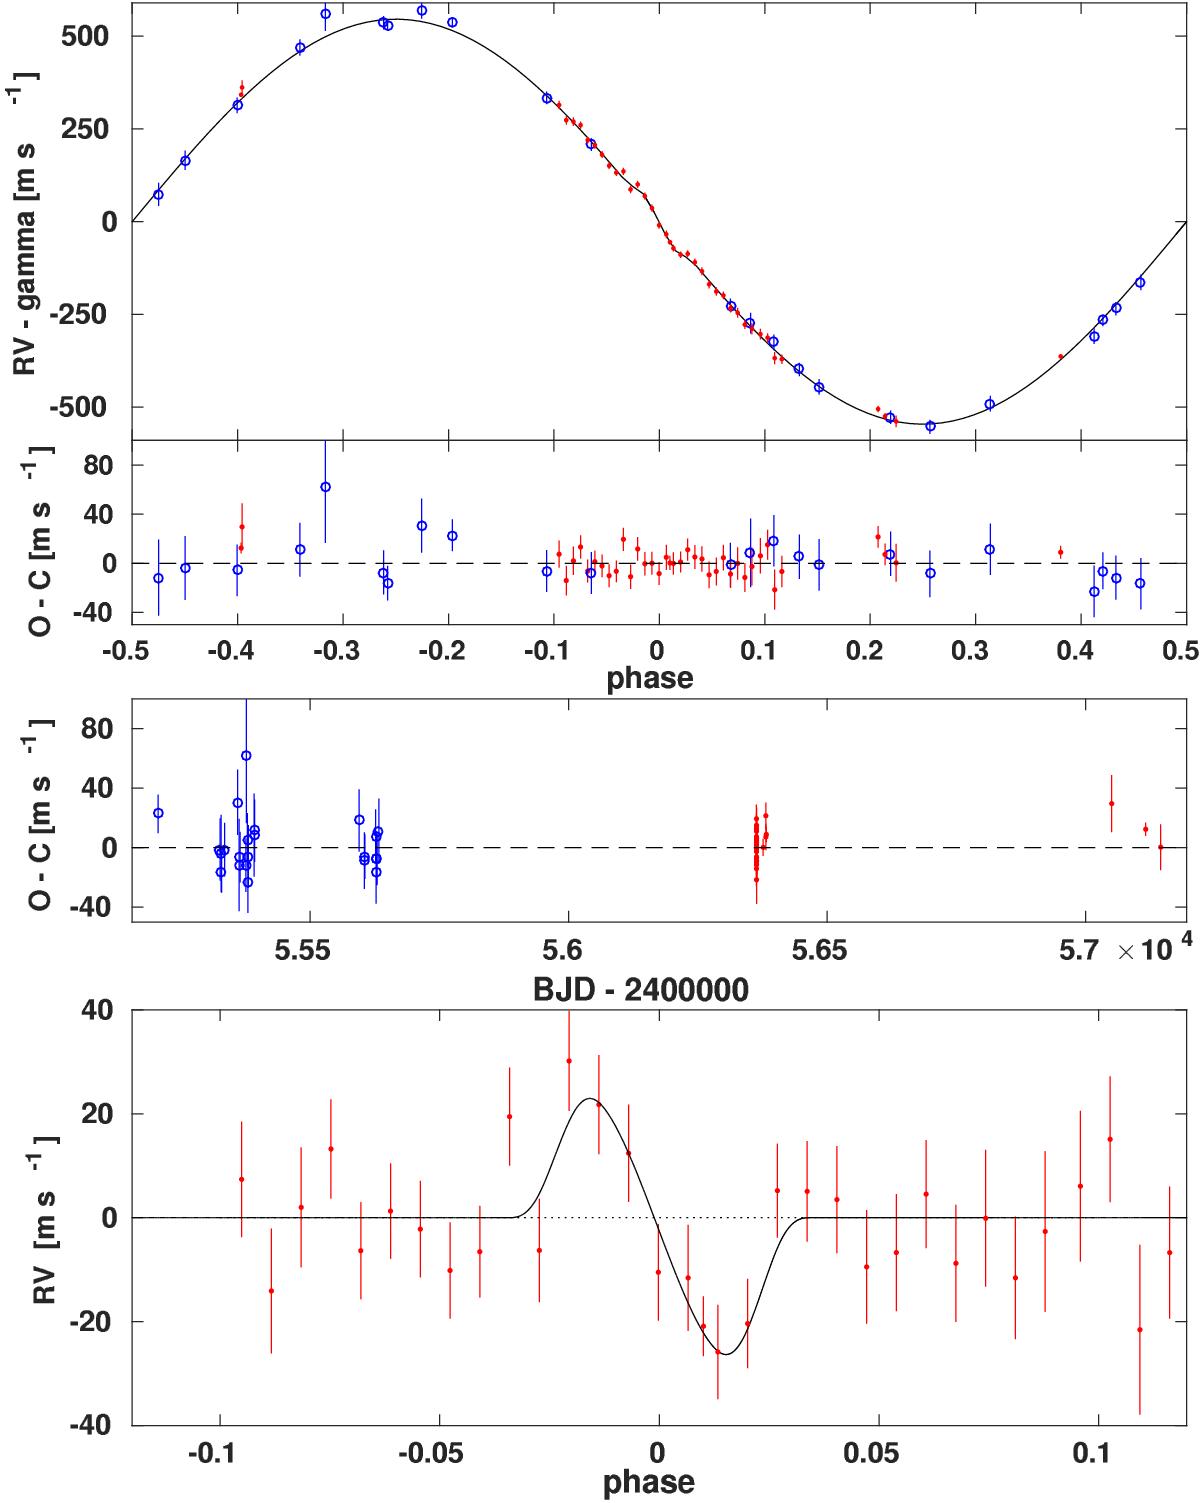
WASP-43 radial velocities. Red dots represent HARPS-N data while blue open circles are CORALIE data. Top panels: phase-folded RVs with the best-fit RV curve superimposed, and below the corresponding residuals. Middle panel: RV residuals plotted as a function of the Barycentric Julian Date (BJD) show no evidence of a long term RV trend. Bottom panel: zoom in the RV time-series covering the transit. To highlight the RM effect, the orbital RV trend was subtracted.
Current usage metrics show cumulative count of Article Views (full-text article views including HTML views, PDF and ePub downloads, according to the available data) and Abstracts Views on Vision4Press platform.
Data correspond to usage on the plateform after 2015. The current usage metrics is available 48-96 hours after online publication and is updated daily on week days.
Initial download of the metrics may take a while.