Fig. 6
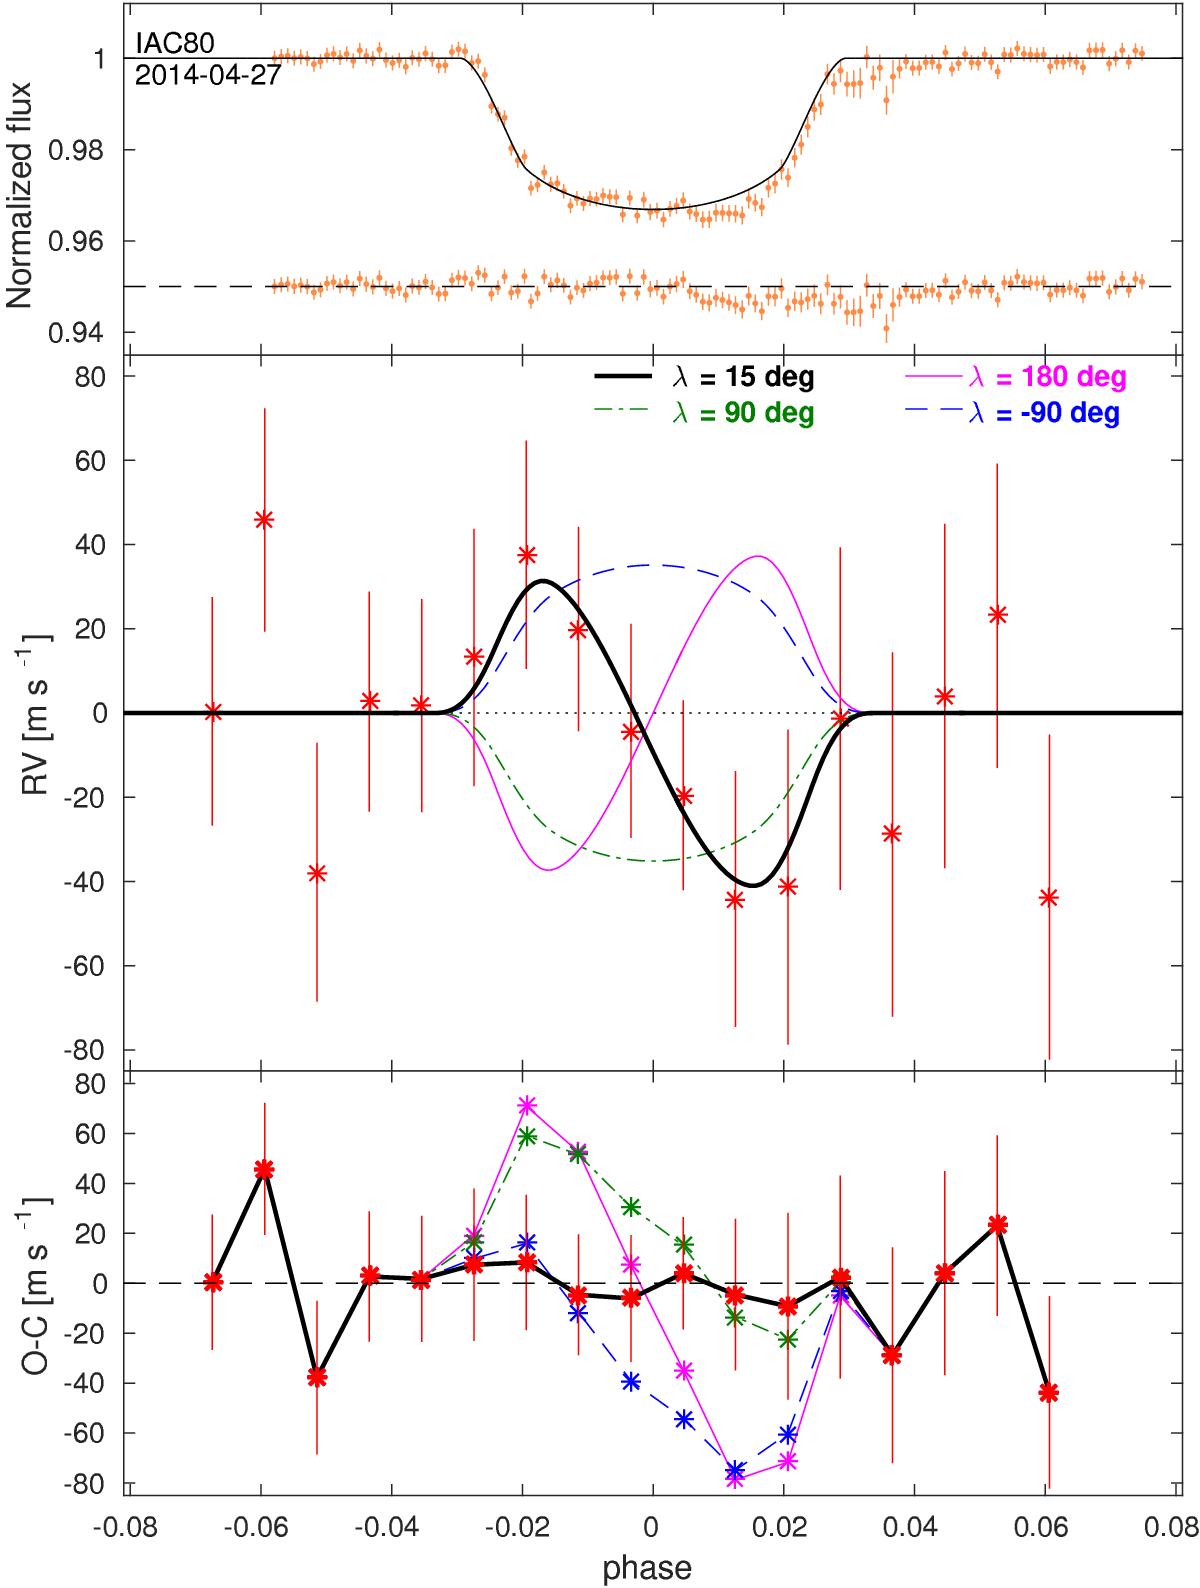
Simultaneous photometric and RV monitoring of the transit of Qatar-2 b. Top panel: IAC80 photometric data. The black line is the model light curve, but it is not a fit to the data (see text in Sect. 4.3 for details). Middle panel: RV time-series covering the transit (red asterisks). To highlight the RM effect, the orbital RV trend was subtracted. Together with our best-fit model (black thick line), we also show models with VsinI⋆ = 2.0 km s-1 and λ = −90, 90, 180 deg (dashed blue, dot-dashed green, magenta lines, respectively). Bottom panel: RV residuals for the best-fit model of the RM effect and for the other three models shown in the middle panel.
Current usage metrics show cumulative count of Article Views (full-text article views including HTML views, PDF and ePub downloads, according to the available data) and Abstracts Views on Vision4Press platform.
Data correspond to usage on the plateform after 2015. The current usage metrics is available 48-96 hours after online publication and is updated daily on week days.
Initial download of the metrics may take a while.