Free Access
Fig. 6
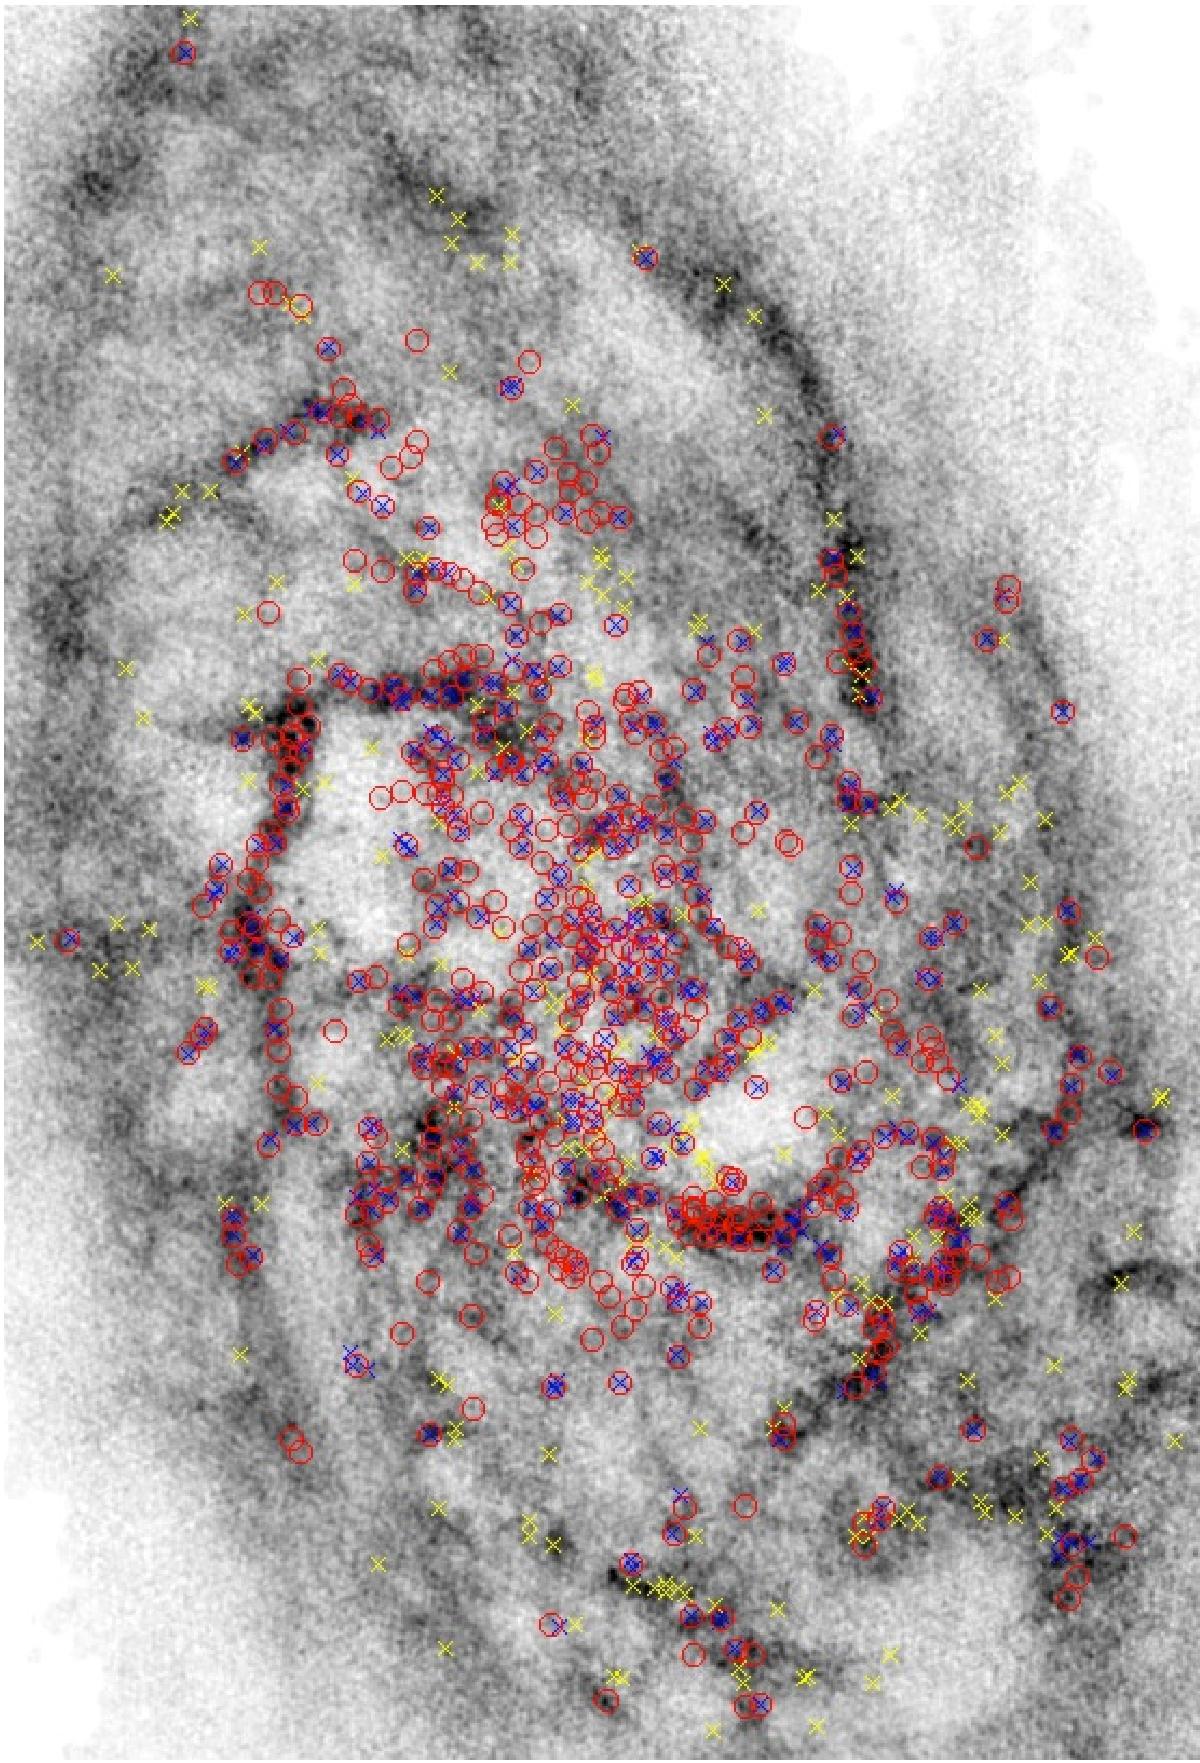
Positions of GMCs and YSCCs analyzed in this paper plotted on top of the 21 cm map at 10 arcsec resolution. Red circles indicate the positions of GMCs, blue and yellow crosses indicate the position of YSCCs that are associated with clouds and those that are not, respectively.
Current usage metrics show cumulative count of Article Views (full-text article views including HTML views, PDF and ePub downloads, according to the available data) and Abstracts Views on Vision4Press platform.
Data correspond to usage on the plateform after 2015. The current usage metrics is available 48-96 hours after online publication and is updated daily on week days.
Initial download of the metrics may take a while.