Fig. 4
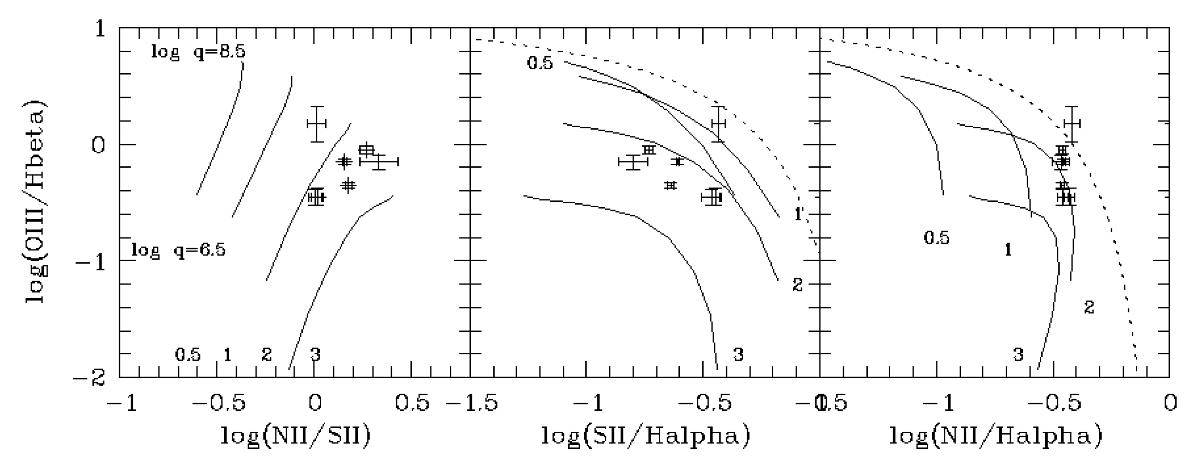
Diagnostic graphs for six selected emission line spectra in SH2 (see Table 3 and Sect. 5.2 for explanation). These spectra are compared to Hii region models from Dopita et al. (2013) with the ionisation parameter log q and four oxygen abundances (0.5 × solar, solar, 2 × solar, and 3 × solar) as parameters. The solid lines are lines of constant oxygen abundance and varying log q. In the left panel, the range of log q values is indicated, and is the same for all panels. The models refer to κ = ∞ (corresponding to a Boltzmann electron distribution). The dotted lines in the middle and right panels separate Hii regions from AGN- and LINER-spectra according to Kewley et al. (2001). All spectra except 25:17 are consistent with a uniform abundance value, although [Oiii]/Hβ varies significantly. The middle and the right graph show the degeneracy for high metallicities that is not present in the left graph. A super-solar oxygen abundance is supported by all three diagnostic graphs.
Current usage metrics show cumulative count of Article Views (full-text article views including HTML views, PDF and ePub downloads, according to the available data) and Abstracts Views on Vision4Press platform.
Data correspond to usage on the plateform after 2015. The current usage metrics is available 48-96 hours after online publication and is updated daily on week days.
Initial download of the metrics may take a while.