Fig. 8
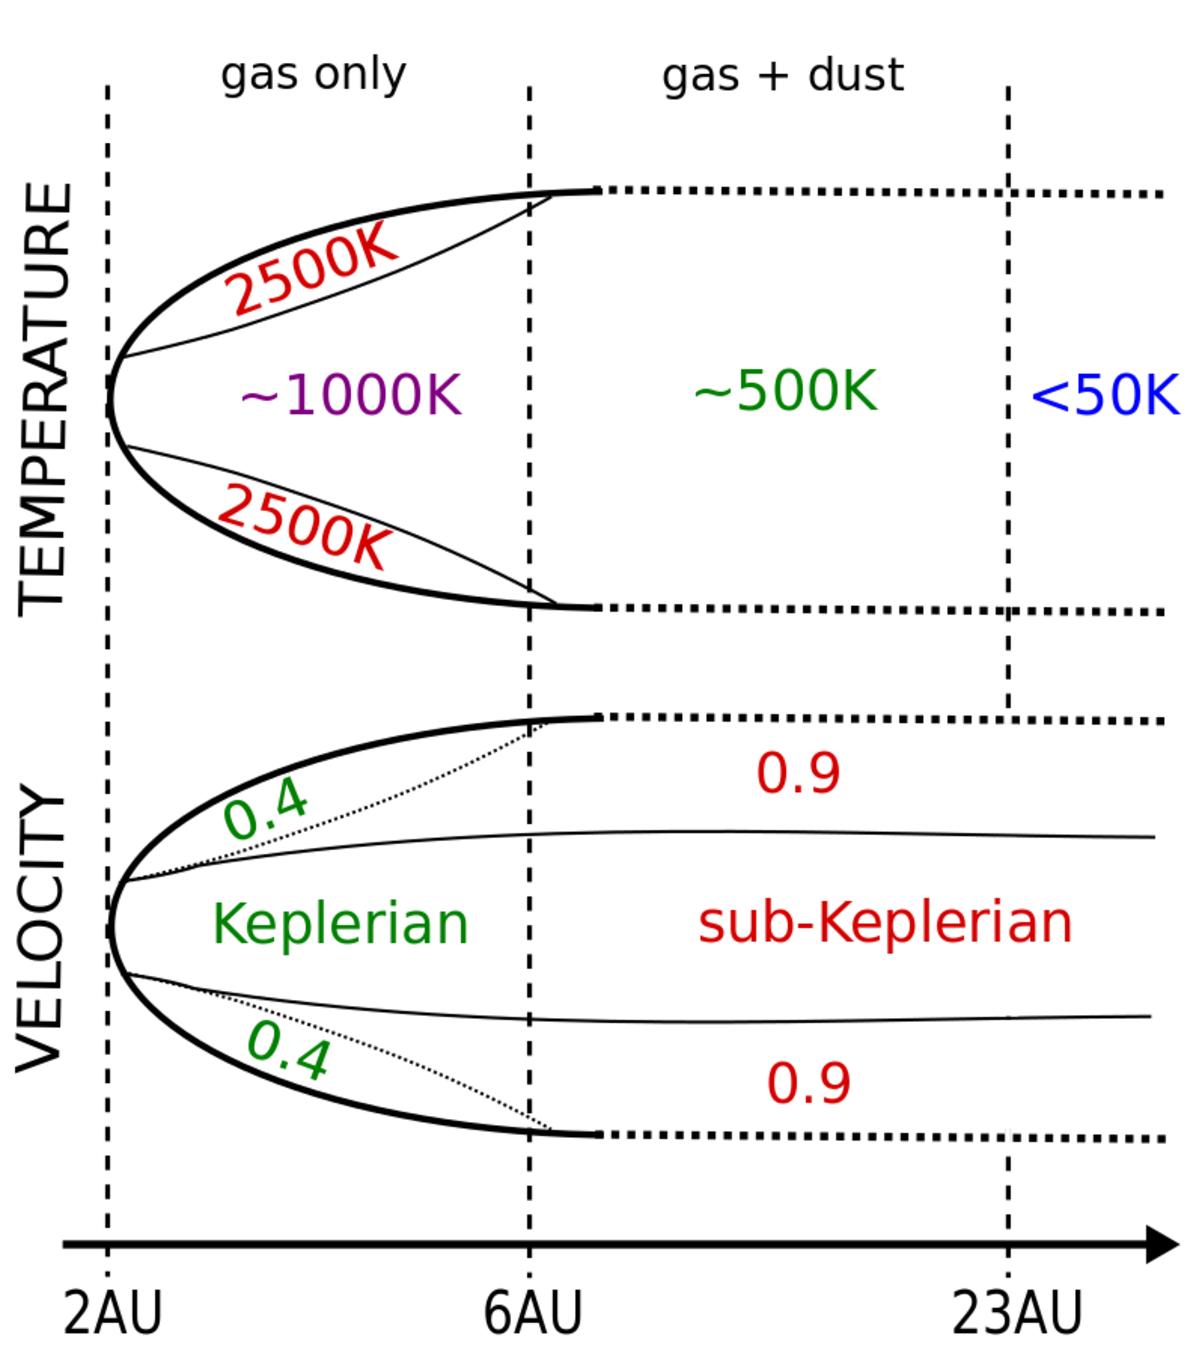
Schematic representation of the inner disk velocity and temperature structure, as deduced from the radiative transfer modelling. The global and internal features are not to scale. In the velocity diagram, the numerical values correspond to the multiplication factor with which the equatorial speeds are multiplied to obtain the lowest measured velocities in the regions with high vertical offsets. The colour coding makes the distinction between the inner disk (r< 6 AU) and the outer disk (r> 6 AU). The radial density structure is not represented here, it is simply characterised by a power law with slope −3.1.
Current usage metrics show cumulative count of Article Views (full-text article views including HTML views, PDF and ePub downloads, according to the available data) and Abstracts Views on Vision4Press platform.
Data correspond to usage on the plateform after 2015. The current usage metrics is available 48-96 hours after online publication and is updated daily on week days.
Initial download of the metrics may take a while.