Fig. 2
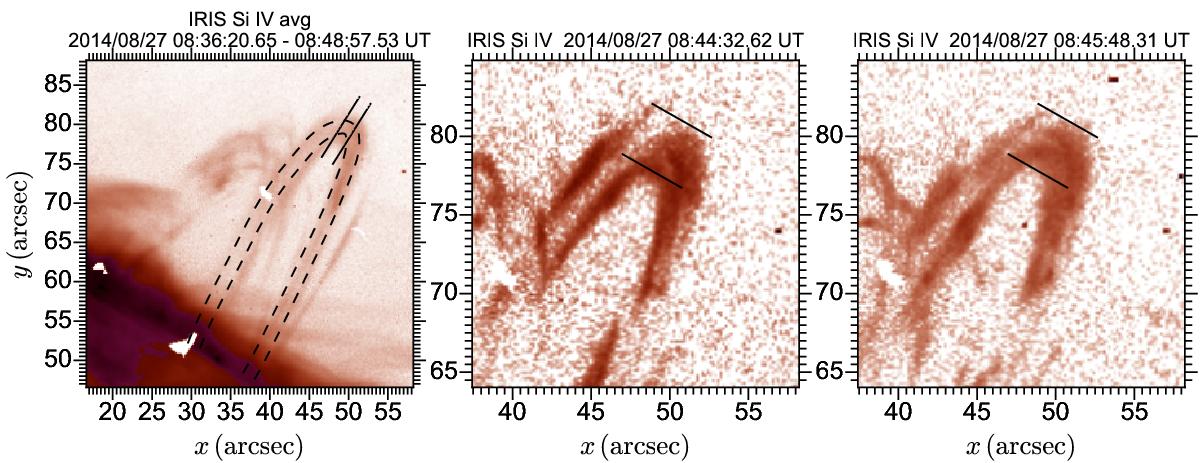
Partial FOV of the IRIS Si IV observations in inverted intensity. Left: image averaged over 40 consecutive exposures. The two solid lines delineate the data cut across the loop top. The two dashed lines delineate the data cut along the loop. Middle and right: observations at two particular times that correspond to a down and up phase of the oscillation. Two parallel lines are provided as fixed reference points.
Current usage metrics show cumulative count of Article Views (full-text article views including HTML views, PDF and ePub downloads, according to the available data) and Abstracts Views on Vision4Press platform.
Data correspond to usage on the plateform after 2015. The current usage metrics is available 48-96 hours after online publication and is updated daily on week days.
Initial download of the metrics may take a while.