Fig. 16
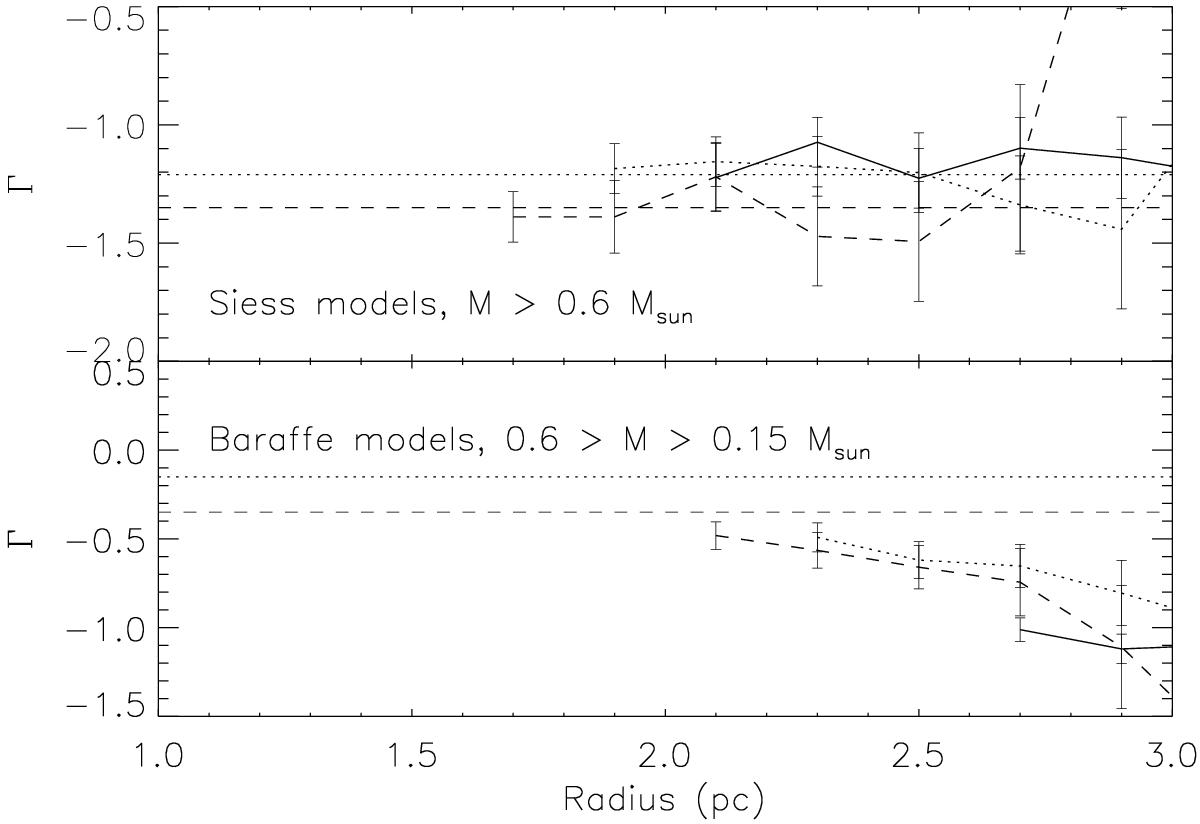
Power-law fits for the low-mass content in Wd1. Fits are performed for masses larger than 0.6 M⊙ (top, Siess isochrones) and for the mass range 0.15 M⊙< 0.6 M⊙ (bottom, Baraffe isochrones). The values derived for the ONC (Muench et al. 2002) are shown as the dotted lines and the Kroupa (2002) slopes are shown as the dashed line.
Current usage metrics show cumulative count of Article Views (full-text article views including HTML views, PDF and ePub downloads, according to the available data) and Abstracts Views on Vision4Press platform.
Data correspond to usage on the plateform after 2015. The current usage metrics is available 48-96 hours after online publication and is updated daily on week days.
Initial download of the metrics may take a while.