Fig. 18
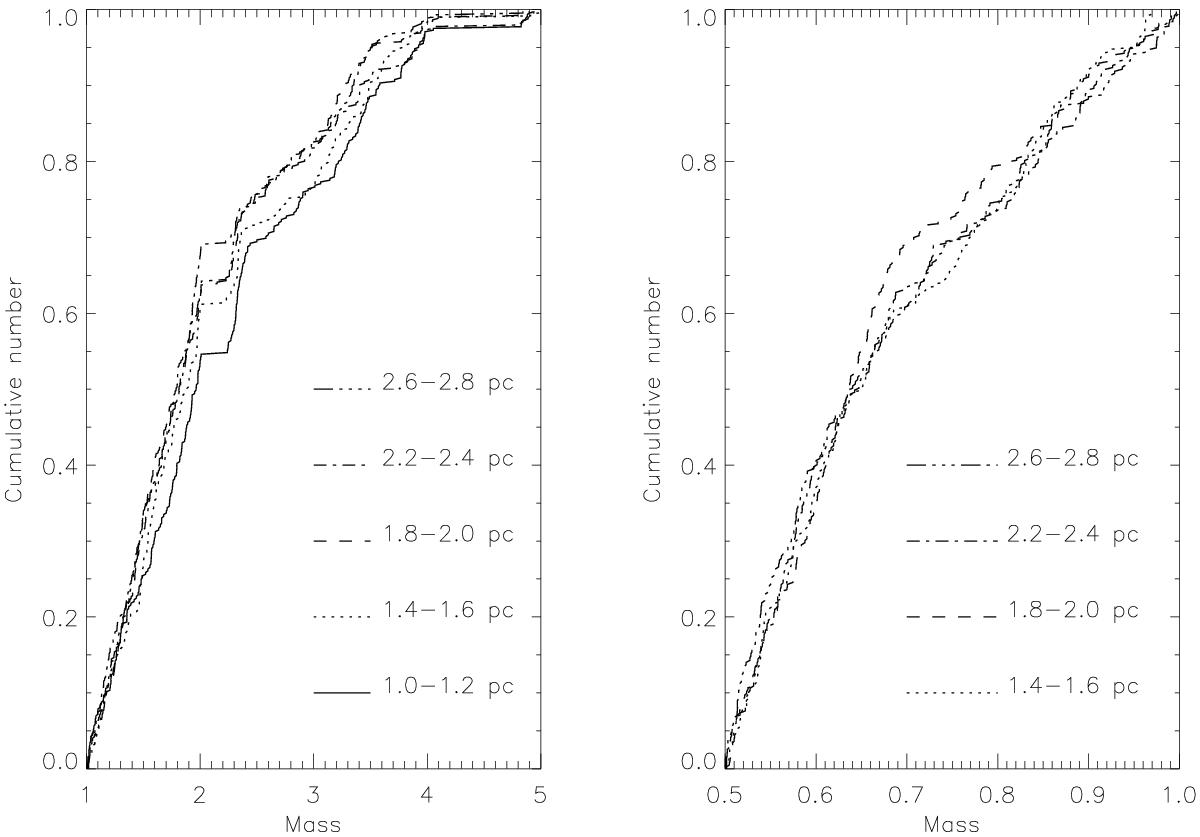
Cumulative mass functions adopting a Tognelli et al. (2011) 4 Myr isochrone. The left panel shows the cumulative mass functions for the mass range 1–5 M⊙, whereas the right panel shows the cumulative mass functions for the 0.5–2 M⊙ range. The radial range where the comparison can be carried out varies for the two different lower mass limits.
Current usage metrics show cumulative count of Article Views (full-text article views including HTML views, PDF and ePub downloads, according to the available data) and Abstracts Views on Vision4Press platform.
Data correspond to usage on the plateform after 2015. The current usage metrics is available 48-96 hours after online publication and is updated daily on week days.
Initial download of the metrics may take a while.