Free Access
Fig. 5
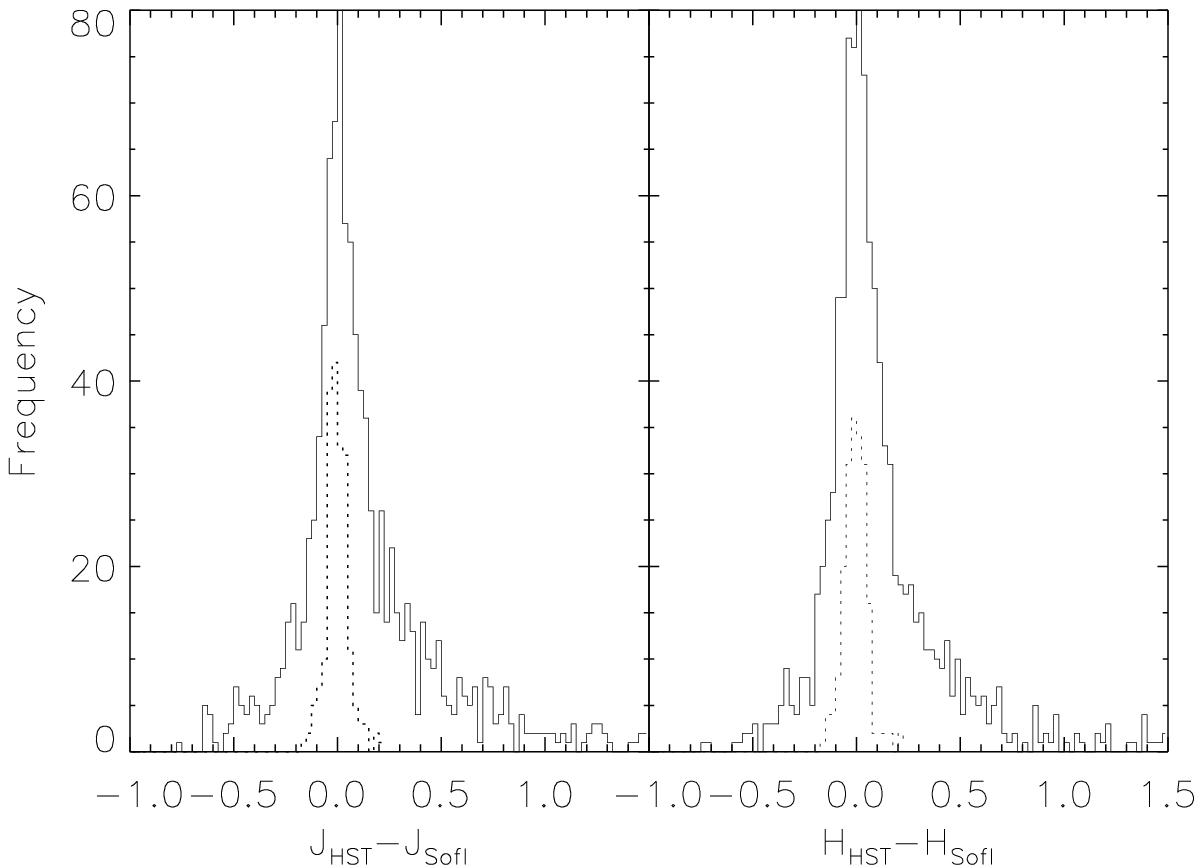
Difference between the J and H SOfI and HST photometry for the control field, after both have been converted into the 2MASS system. The dashed-lined histograms show the differences for the objects identified as isolated objects and the solid-lined histograms show the difference for all objects identified in both datasets.
Current usage metrics show cumulative count of Article Views (full-text article views including HTML views, PDF and ePub downloads, according to the available data) and Abstracts Views on Vision4Press platform.
Data correspond to usage on the plateform after 2015. The current usage metrics is available 48-96 hours after online publication and is updated daily on week days.
Initial download of the metrics may take a while.