Fig. 9
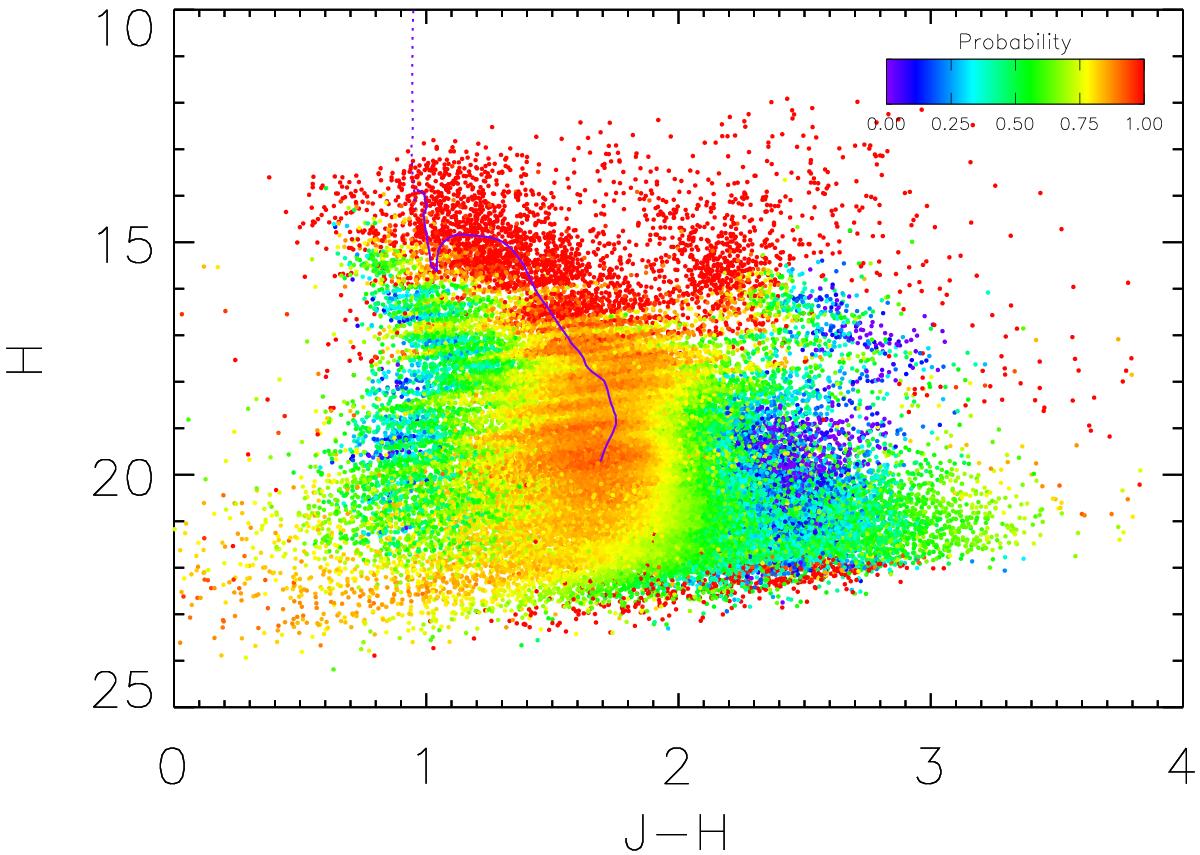
J − H versus H colour–magnitude diagram of Wd1. The colour scale shows the probability for a star to be a cluster member based on the field star subtraction method described in the text. We note that the population of red clump stars erroneously characterised as high probability cluster members. This is due to the small differences in extinction along the line of sight. Overplotted is a reddened (by Ak = 0.92) Siess et al. (2000) 4 Myr isochrone shifted to a distance of 4.8 kpc. The (reddened) MS from Marigo et al. (2008) is shows as the dotted line.
Current usage metrics show cumulative count of Article Views (full-text article views including HTML views, PDF and ePub downloads, according to the available data) and Abstracts Views on Vision4Press platform.
Data correspond to usage on the plateform after 2015. The current usage metrics is available 48-96 hours after online publication and is updated daily on week days.
Initial download of the metrics may take a while.