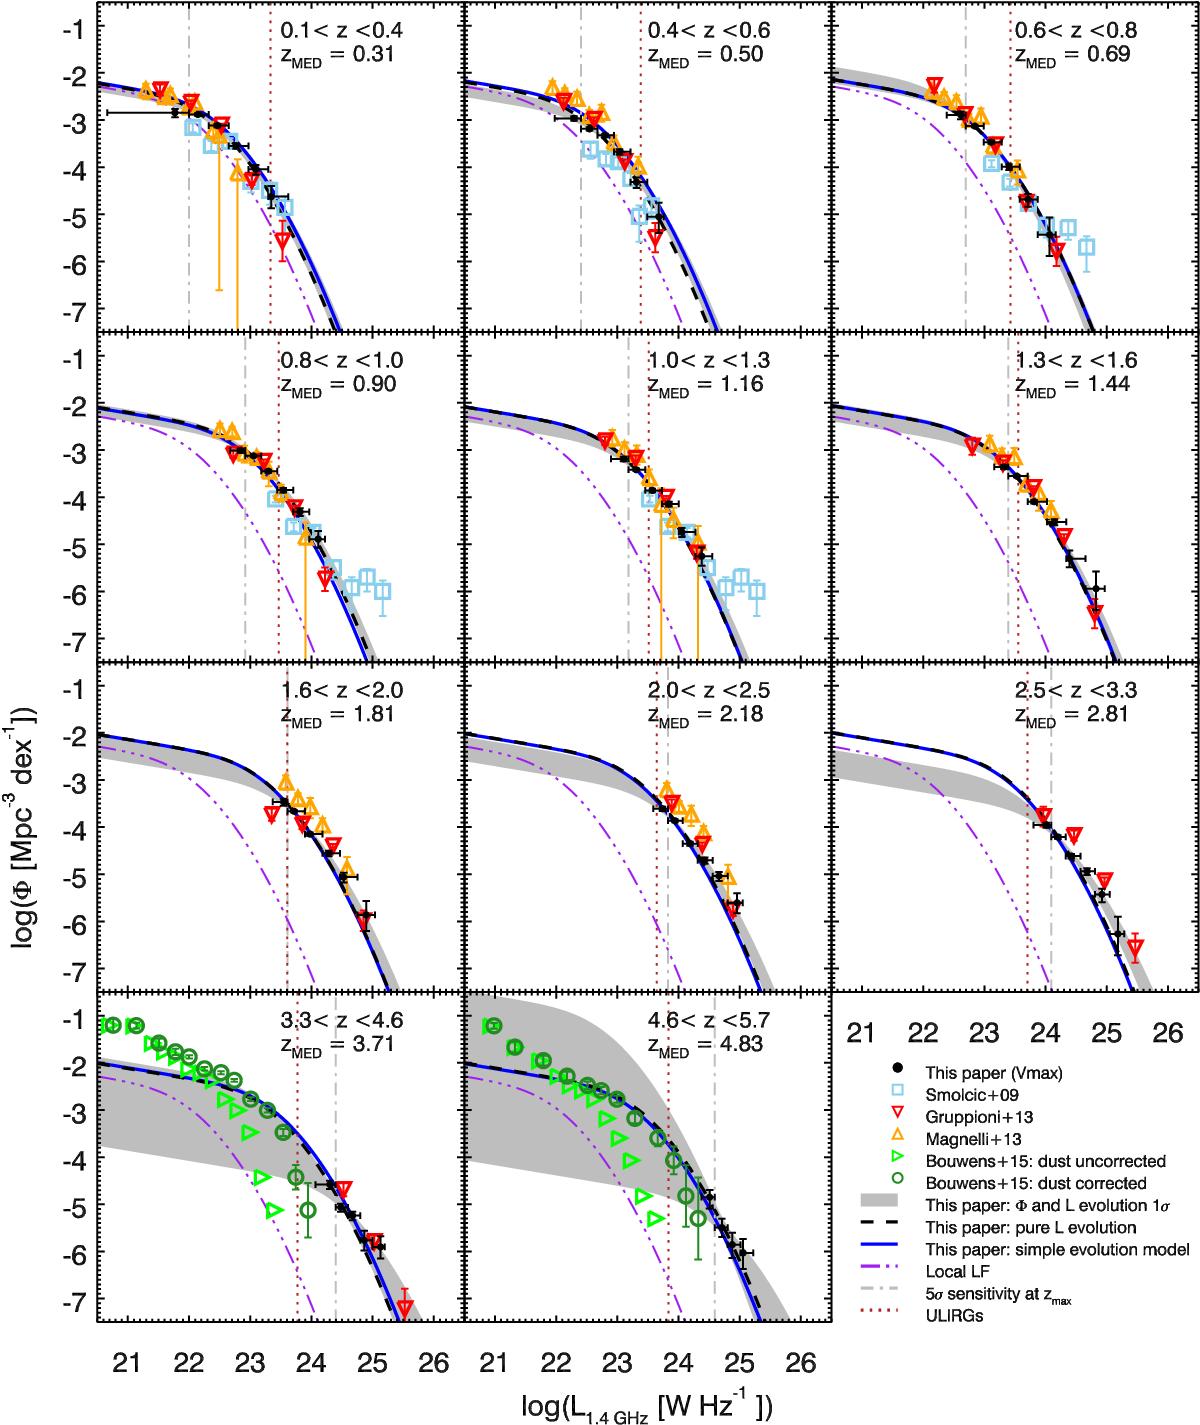
Fig. 4

Radio luminosity functions of star-forming galaxies in different redshift bins (black filled circles). Best-fit pure luminosity evolved function in each redshift bin is shown with black dashed lines. Combined luminosity and density evolution are shown by the gray shaded area (using 68% confidence region in αD, αL parameter space around the minimum χ2). The local radio function is shown for reference as a triple-dot-dashed purple line. The vertical dot-dashed line corresponds to the 5σ luminosity limit at the high redshift end of the bin (1σ = 2.3 μJy beam-1 at 3 GHz) under the assumption of a fixed spectral index α = −0.7. The vertical red dotted line defines the radio luminosity corresponding to ULIRGs under the assumption of redshift evolving qTIR. The redshift range and median redshift of sources in that bin are given in each panel. All data shown for comparison are indicated in the legend in the bottom right corner; see Sect. 5 for details.
Current usage metrics show cumulative count of Article Views (full-text article views including HTML views, PDF and ePub downloads, according to the available data) and Abstracts Views on Vision4Press platform.
Data correspond to usage on the plateform after 2015. The current usage metrics is available 48-96 hours after online publication and is updated daily on week days.
Initial download of the metrics may take a while.


