Fig. 7
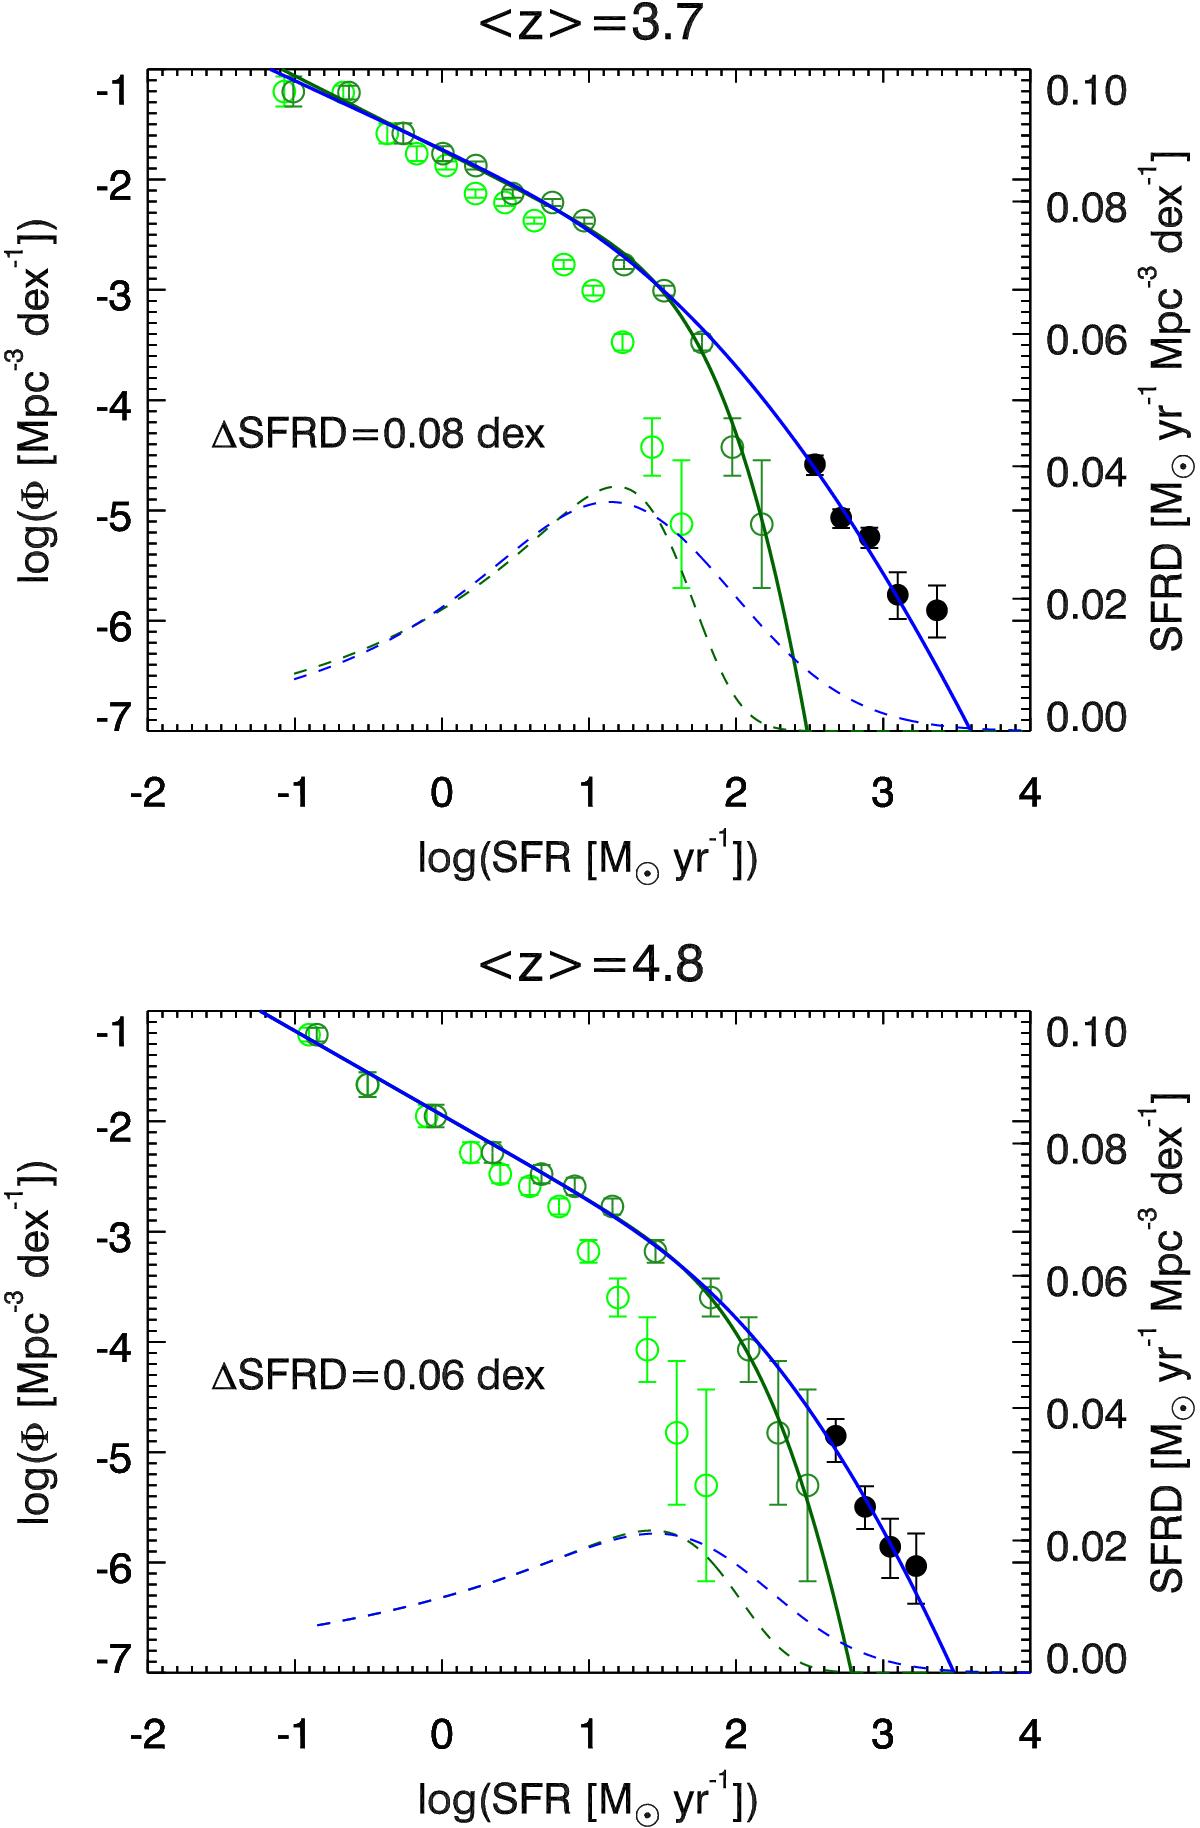
Number density of UV (Bouwens et al. 2015) and our radio SF galaxies as a function of SFR in the two highest redshift bins. Dust-corrected (uncorrected) UV data are shown with dark (light) green open circles, and our radio data are shown with filled black circles. A fit with the functional form given in Eq. (7) is performed on the UV data only (green full line) and the radio plus faint UV data (blue full line). Dashed lines show the SFRD contribution with the scale given on the right axis. See text for details.
Current usage metrics show cumulative count of Article Views (full-text article views including HTML views, PDF and ePub downloads, according to the available data) and Abstracts Views on Vision4Press platform.
Data correspond to usage on the plateform after 2015. The current usage metrics is available 48-96 hours after online publication and is updated daily on week days.
Initial download of the metrics may take a while.