Fig. 8
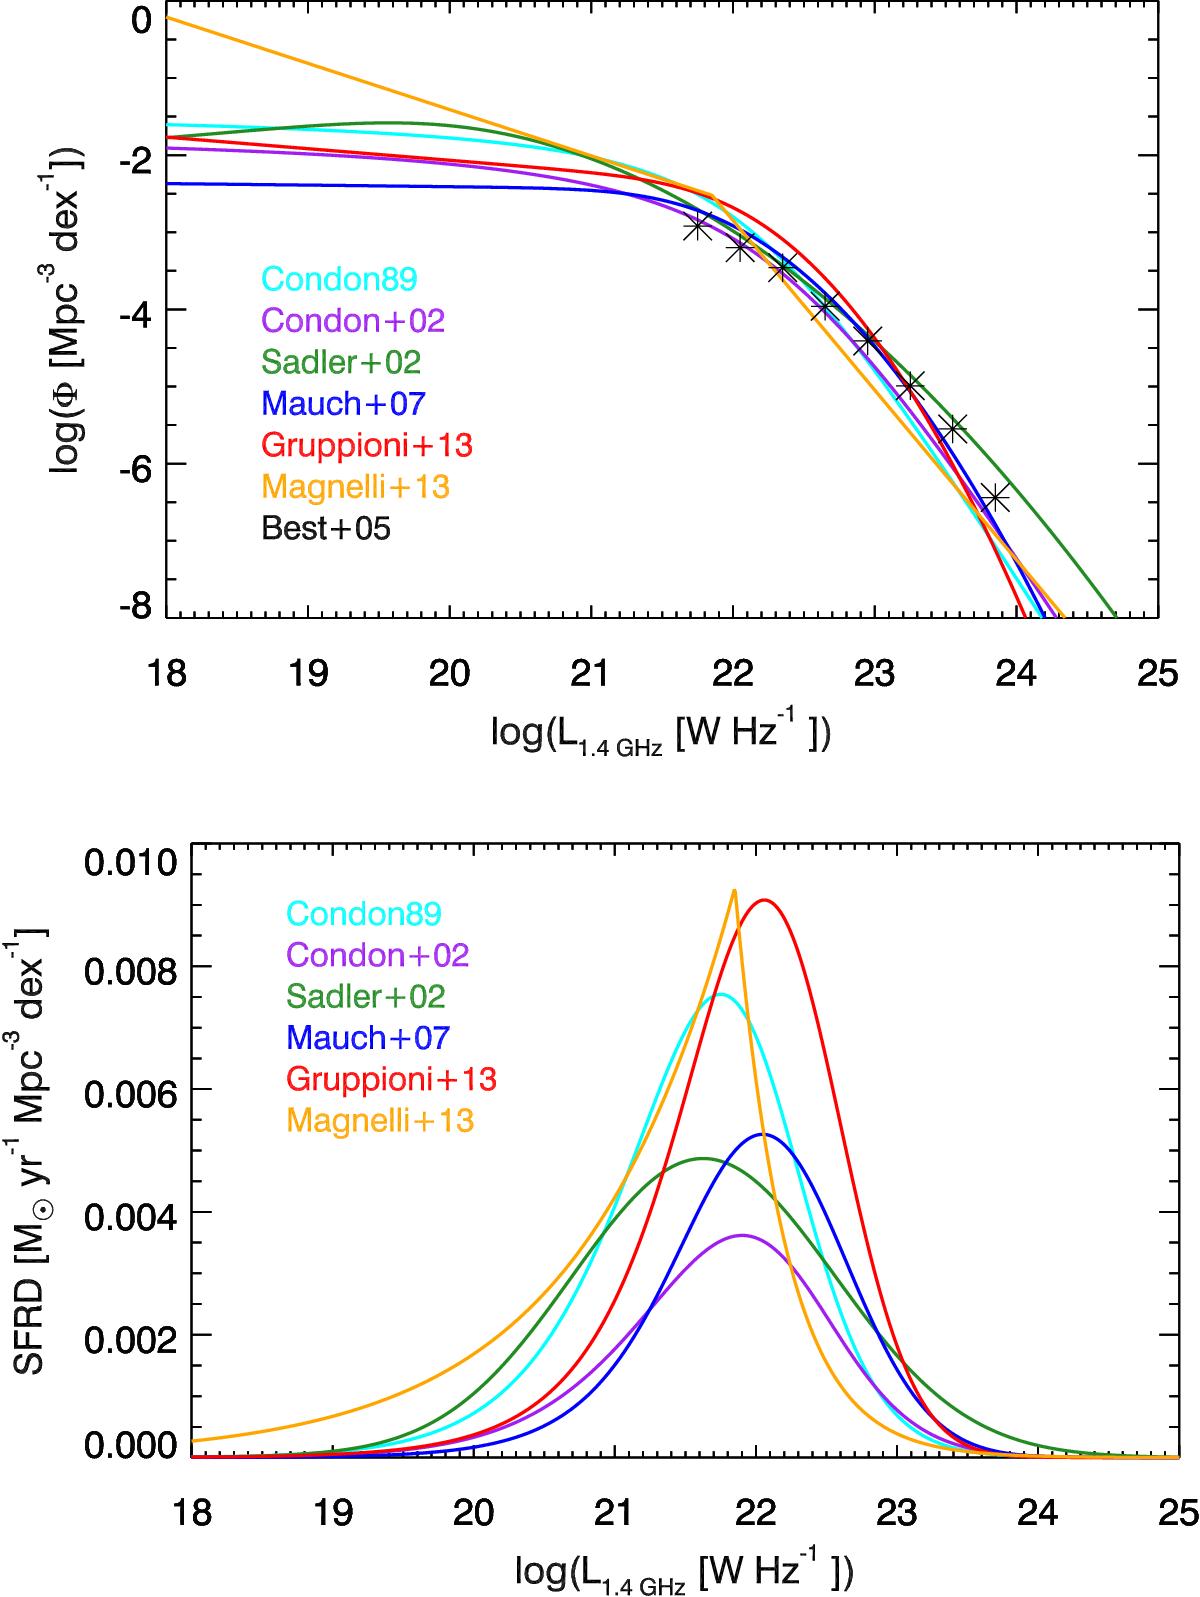
Top: local radio and IR LF at 1.4 GHz from various authors as indicated in the legend. Red and orange lines correspond to IR data while all other lines are derived from radio data. Best et al. (2005) did not attempt to fit an analytical form so we show their points as asterisks. Functional forms are either broken power law (orange), hyperbolic form (cyan and purple), or power law plus lognormal (green, blue, and red). Bottom: LFs converted to SFRD per logarithm of luminosity using Eq. (13) and a local qTIR = 2.64 value from Bell (2003).
Current usage metrics show cumulative count of Article Views (full-text article views including HTML views, PDF and ePub downloads, according to the available data) and Abstracts Views on Vision4Press platform.
Data correspond to usage on the plateform after 2015. The current usage metrics is available 48-96 hours after online publication and is updated daily on week days.
Initial download of the metrics may take a while.