Fig. 1
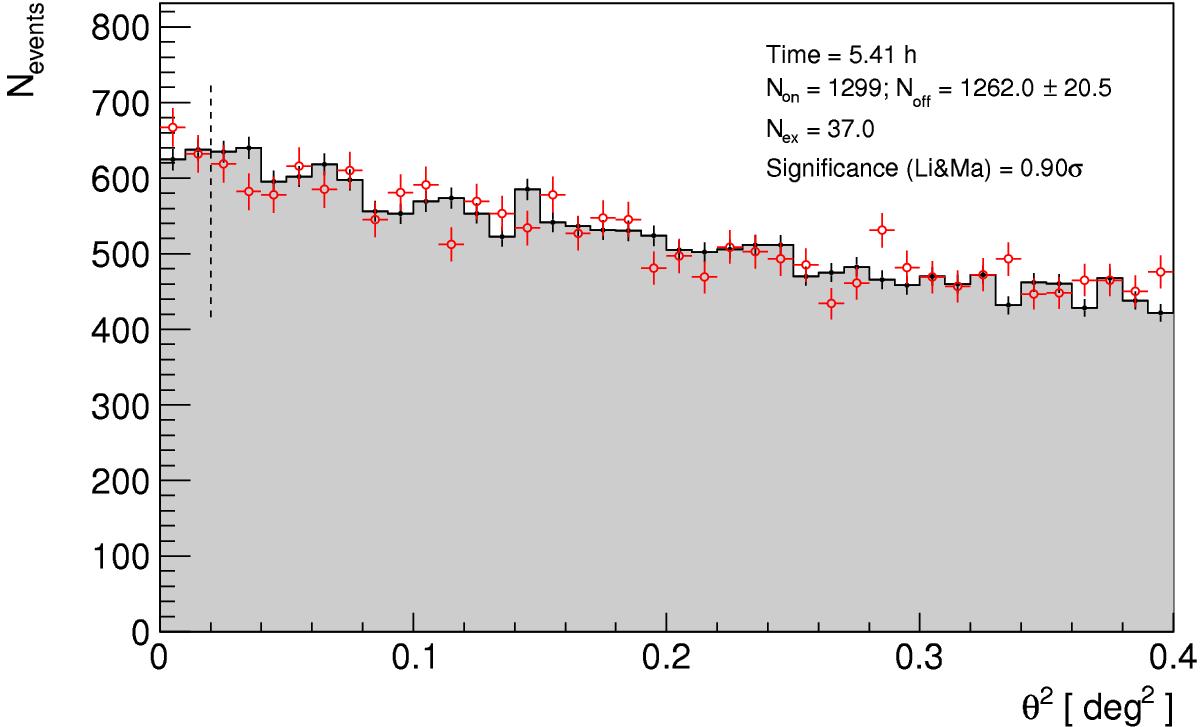
Distribution of the squared angular distance, θ2, after 5.41 h of observation between the reconstructed arrival direction of the gamma-ray candidate events and the position of the source in the camera (red empty circles). The θ2 distribution of the background events (black points) is also displayed. The vertical dashed line at θ2 = 0.02 deg2 defines the expected signal region.
Current usage metrics show cumulative count of Article Views (full-text article views including HTML views, PDF and ePub downloads, according to the available data) and Abstracts Views on Vision4Press platform.
Data correspond to usage on the plateform after 2015. The current usage metrics is available 48-96 hours after online publication and is updated daily on week days.
Initial download of the metrics may take a while.