Free Access
Fig. 11
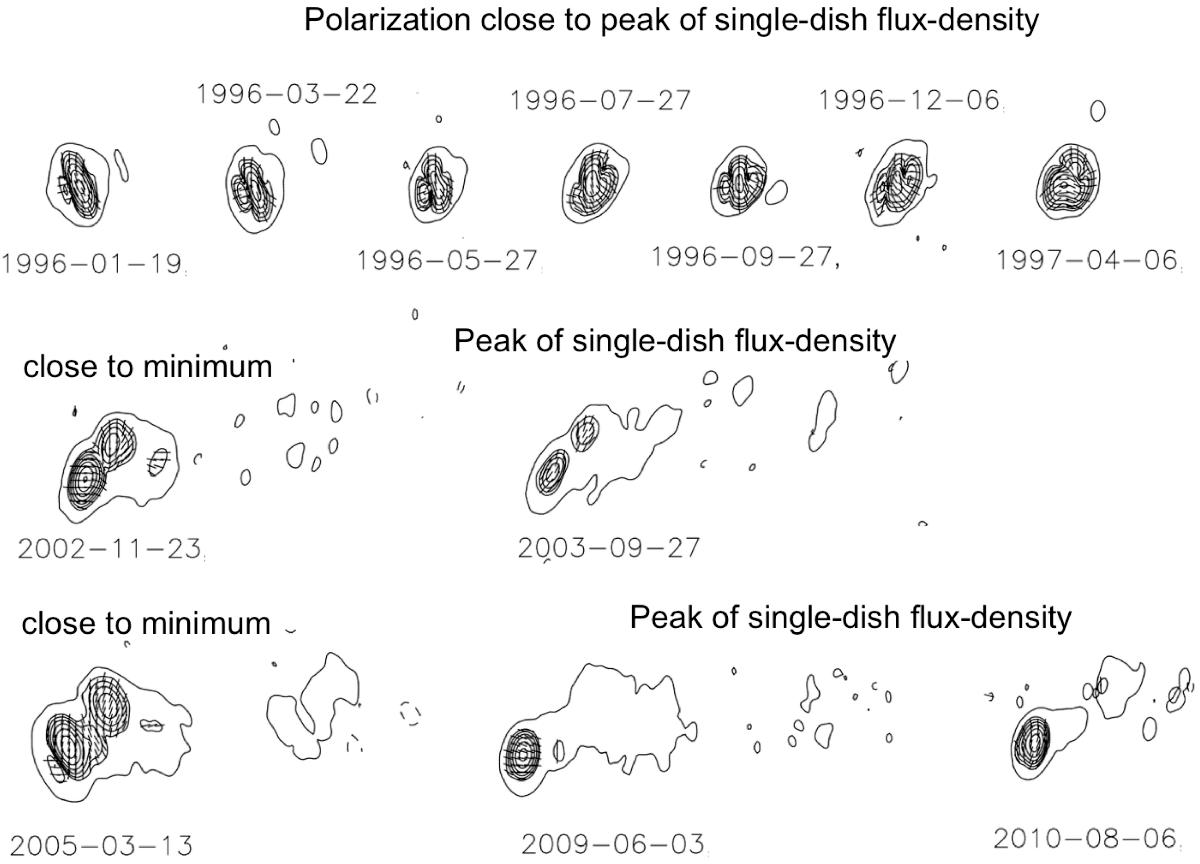
Polarization information taken from the MOJAVE webpage. We selected epochs with polarization information available close to the maxima in the single-dish flux-density light-curve. For comparison, we plot epochs close to a minimum of the light-curve. For the scale: the last image shows the inner 8mas.
Current usage metrics show cumulative count of Article Views (full-text article views including HTML views, PDF and ePub downloads, according to the available data) and Abstracts Views on Vision4Press platform.
Data correspond to usage on the plateform after 2015. The current usage metrics is available 48-96 hours after online publication and is updated daily on week days.
Initial download of the metrics may take a while.