Fig. 12
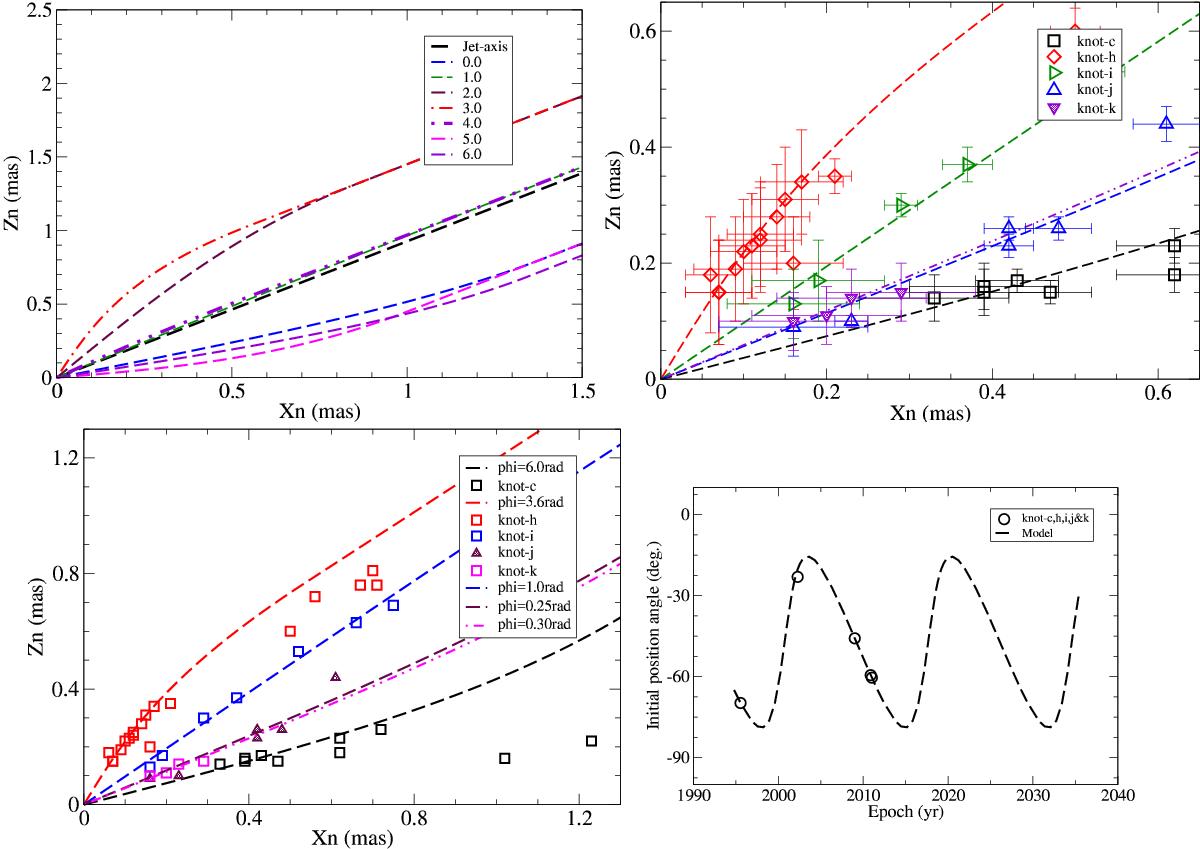
Top (left): range of the precessing trajectory. The numbers mentioned in the legend are relative precession phases (in units of radians). Top (right): results of the fitting process of the trajectories within 0.5 mas of core-separation. Bottom (left): change of the knot trajectories beyond 0.5 mas. phi denotes for the relative precession phase of the knots. Bottom (right): fitting of the position-angle deviations is consistent with a swing period of 16.9 yr.

Current usage metrics show cumulative count of Article Views (full-text article views including HTML views, PDF and ePub downloads, according to the available data) and Abstracts Views on Vision4Press platform.
Data correspond to usage on the plateform after 2015. The current usage metrics is available 48-96 hours after online publication and is updated daily on week days.
Initial download of the metrics may take a while.