Fig. 14

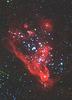
From left to right: VLA and HST observations (VLA: white contour lines, HST: colored map); emission-line gas and radio plasma from helical strings in the Seyfert 2 Galaxy ESO 428-G14 (Falcke et al. 1996, for the scale: the image covers about 0.4 arcsec); the double helix nebula (Galactic center) observed at infrared wavelength of 24 μm with the MIPS camera on the Spitzer Space Telescope (Morris et al. 2005); and a multi-color optical image around the ULX “X-1” (indicated by the arrow) in the dwarf galaxy Holmberg II. The red color in the image (right) represents spectral line emissions from hydrogen atoms (courtesy of the Special Astrophysical Observatory/Hubble Space Telescope). The image size corresponds to 1100 × 900 light-years at the galaxy.


Current usage metrics show cumulative count of Article Views (full-text article views including HTML views, PDF and ePub downloads, according to the available data) and Abstracts Views on Vision4Press platform.
Data correspond to usage on the plateform after 2015. The current usage metrics is available 48-96 hours after online publication and is updated daily on week days.
Initial download of the metrics may take a while.