Fig. 2
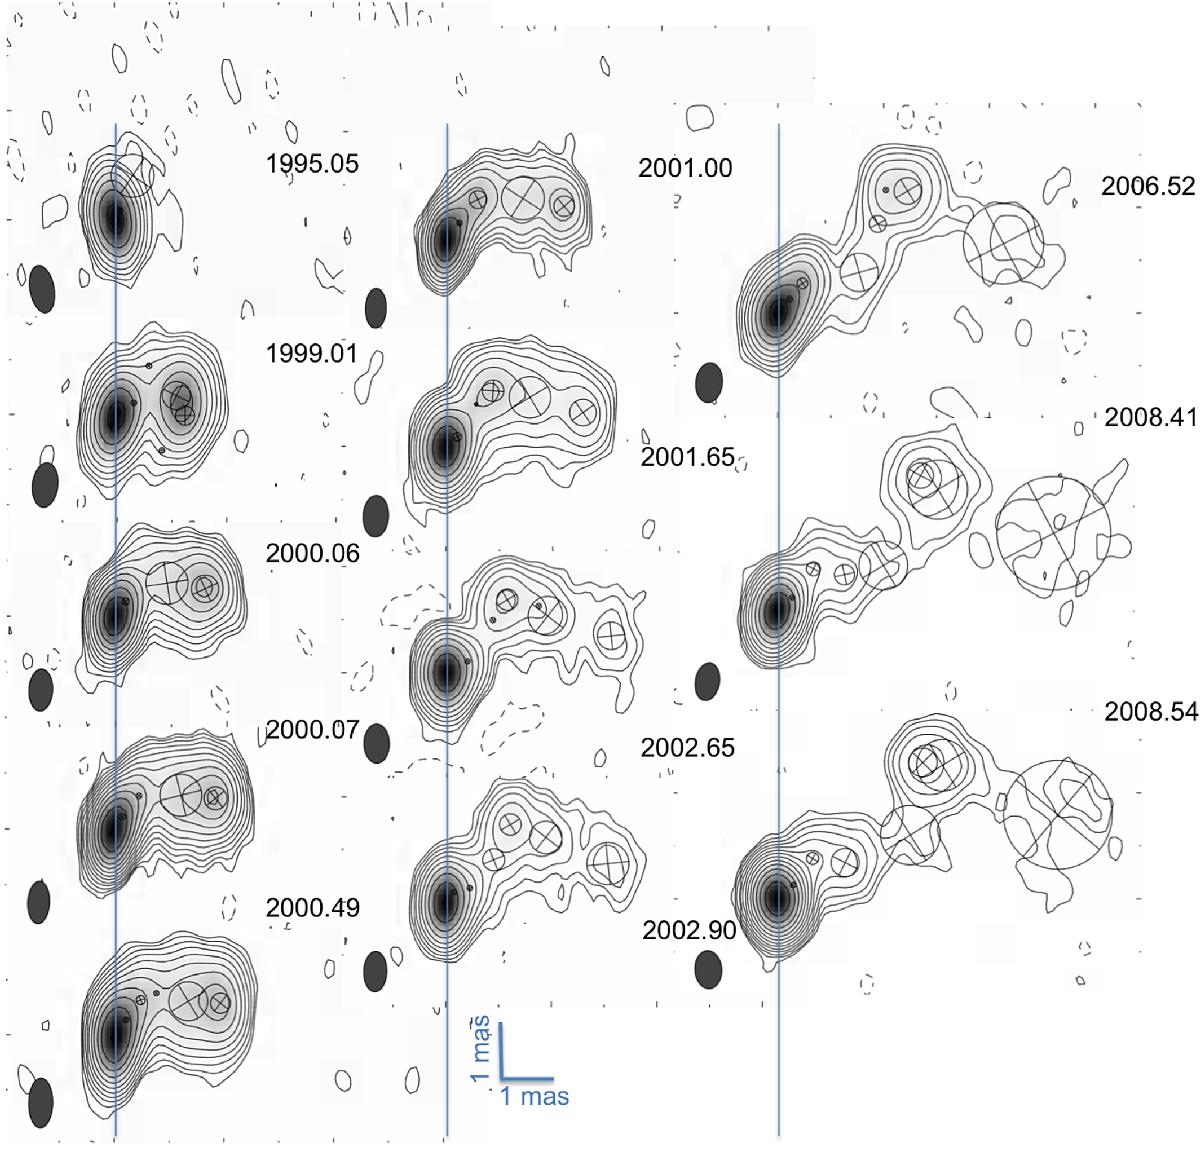
Composite image of several selected VLBI images superimposed by Gaussian modelfit components. The dates of the 15 GHz observations are indicated in the plot. The core position is marked by the light blue line for better comparison. For the scale: in the last image (2008.54) the inner 6 mas are shown. We note that this is a subsample of the total of fifty observations re-modeled and re-analyzed in the paper. The complete set of images can be found in Appendix A. The contour levels shown here are listed in the following notation: lowest level (in percentage of the peak flux) and first positive level (in percentage of the peak flux), highest level (in percentage of the peak flux), and the scale factor between subsequent levels. The contour levels are: –0.6%, 76.8%, 2 (1995.05); –0.3%, 76.8%, 2 (1999.01); –0.5%, 59.3%, 1.7 (2000.06); –0.5%, 59.3%, 1.7 (2000.07); –0.3%, 52.8%, 1.6 (2000.49); –0.7%, 48.8%, 1.7 (2001.00); –0.2%, 51.2%, 2 (2001.65); –0.2%, 51.2%, 2 (2002.65); –0.2%; 51.2%, 2 (2002.90); –0.3%; 76.8%; 2 (2006.52); –0.1%, 51,2%, 2 (2008.41); –0.1%, 58.3%, 17 (2008.54).
Current usage metrics show cumulative count of Article Views (full-text article views including HTML views, PDF and ePub downloads, according to the available data) and Abstracts Views on Vision4Press platform.
Data correspond to usage on the plateform after 2015. The current usage metrics is available 48-96 hours after online publication and is updated daily on week days.
Initial download of the metrics may take a while.