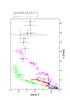
Fig. 4
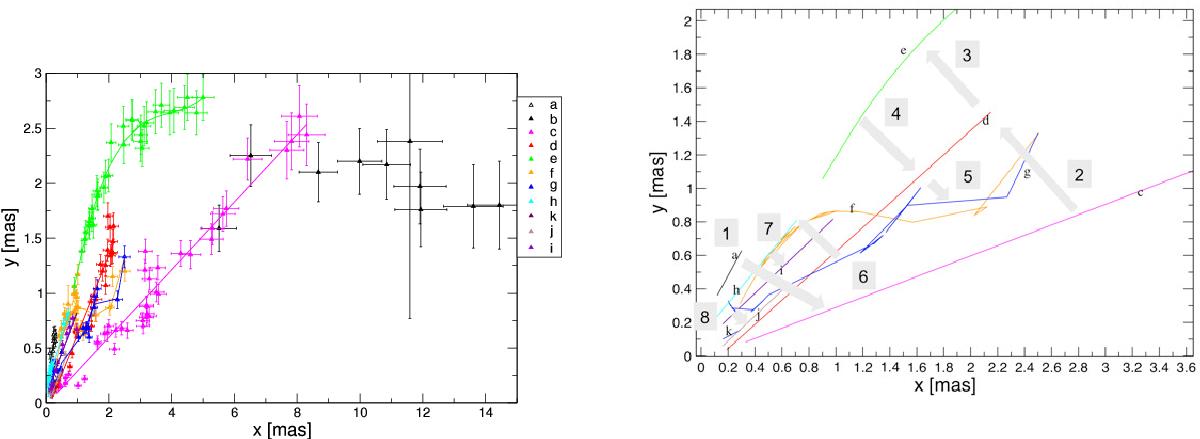
Identified components in x and y coordinates. Linear regression was performed and is shown. For more complex paths, higher order regression was calculated. To visualize the different paths we plot the inner part of the previous figure without the symbols (right), showing only the regression. To trace the rotation please follow the numbers (start at:1, end at: 8). Jet component b is not shown in this plot because data close to the core are not available to determine its path.
Current usage metrics show cumulative count of Article Views (full-text article views including HTML views, PDF and ePub downloads, according to the available data) and Abstracts Views on Vision4Press platform.
Data correspond to usage on the plateform after 2015. The current usage metrics is available 48-96 hours after online publication and is updated daily on week days.
Initial download of the metrics may take a while.