Fig. 3
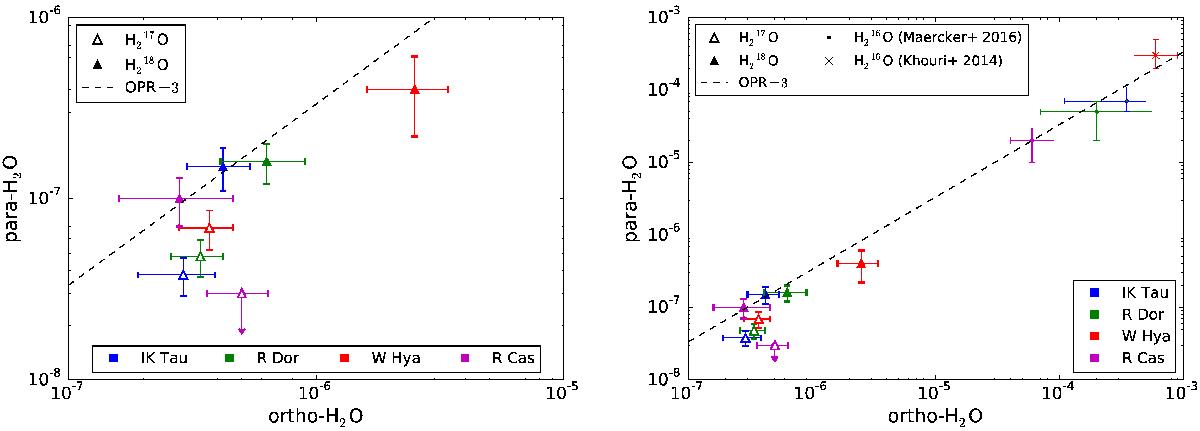
Left: visual representation of the H2O ortho-to-para ratios, separated into H217O (open triangles) and H218O (filled triangles) isotopologues and colour-coded by source (see lower legend). The dotted line indicates the expected ortho-to-para ratio of 3 (see text for more details). Right: same data as shown in the left panel, with the addition of H216O data taken from Maercker et al. (2016) and Khouri et al. (2014b).
Current usage metrics show cumulative count of Article Views (full-text article views including HTML views, PDF and ePub downloads, according to the available data) and Abstracts Views on Vision4Press platform.
Data correspond to usage on the plateform after 2015. The current usage metrics is available 48-96 hours after online publication and is updated daily on week days.
Initial download of the metrics may take a while.