Fig. 10
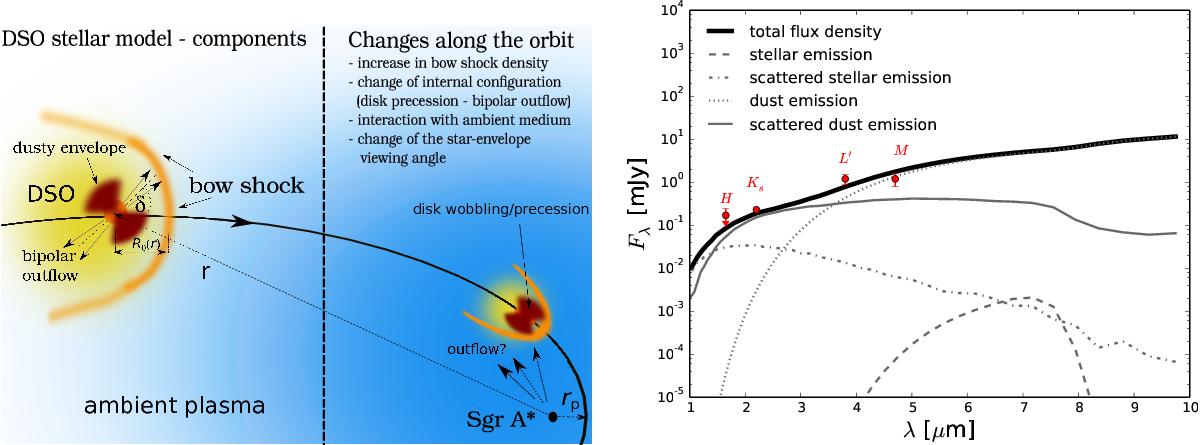
Left: illustration of the components of the DSO model explained as a pre-main-sequence star. The right side explains possible sources of the changes in the continuum emission of the DSO/G2 (polarization degree and angle). Right: calculated SED for the composite model of the DSO (star, dusty envelope, bipolar cavities, bow shock) for the viewing angle of 90°. The thick solid line stands for the total continuum flux density, whereas grey lines represent individual source contributions (see the key). The points represent observationally inferred flux densities/limits for H, Ks, L′, and M bands.
Current usage metrics show cumulative count of Article Views (full-text article views including HTML views, PDF and ePub downloads, according to the available data) and Abstracts Views on Vision4Press platform.
Data correspond to usage on the plateform after 2015. The current usage metrics is available 48-96 hours after online publication and is updated daily on week days.
Initial download of the metrics may take a while.