Fig. 11
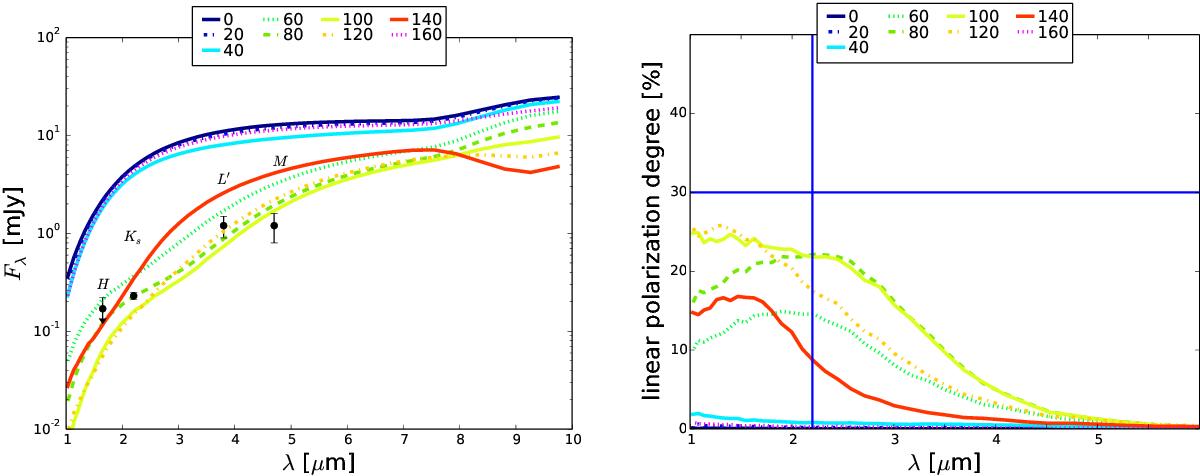
Left: spectral energy distribution of the composite stellar model of the DSO as function of the viewing angle. The points represent observationally inferred values. Different viewing angles from 0° up to 180° are labelled by different colours according to the key. Right: linear polarization degree as function of wavelength for different viewing angles (see the key). The vertical thick line marks the values along the Ks band (2.2 μm), the horizontal line denotes the value of pL = 30%, which is close to observationally inferred values for four consecutive epochs (2008, 2009, 2011, 2012; Shahzamanian et al., 2016).
Current usage metrics show cumulative count of Article Views (full-text article views including HTML views, PDF and ePub downloads, according to the available data) and Abstracts Views on Vision4Press platform.
Data correspond to usage on the plateform after 2015. The current usage metrics is available 48-96 hours after online publication and is updated daily on week days.
Initial download of the metrics may take a while.