Fig. 12
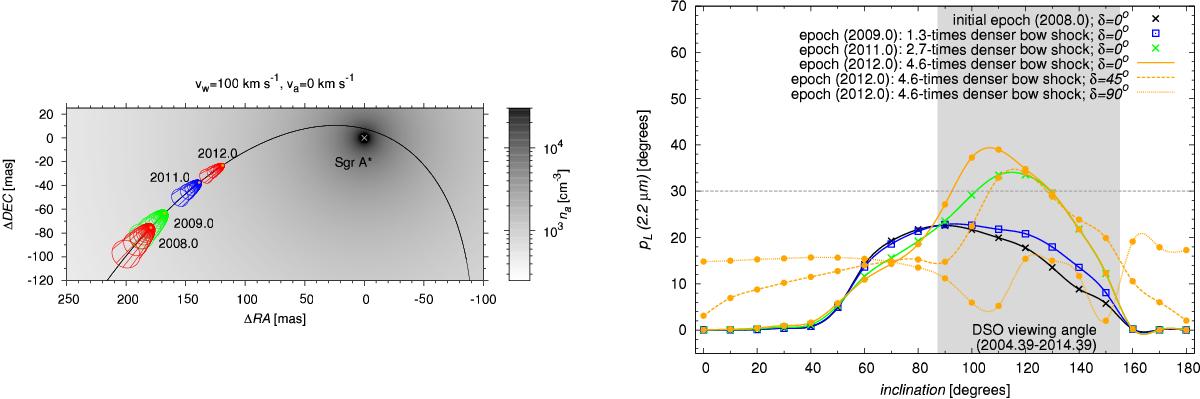
Left: schematic plot of the bow-shock evolution of the DSO along the orbit. The mass-loss rate was taken to be ṁw = 10-8M⊙ yr-1 and the terminal wind velocity is vw = 100 km s-1. The ambient density was colour-coded according the distribution expressed by Eq. (13). Right: total linear polarization degree in Ks band for different inclinations (0–180 degrees) of the DSO composite model. According to the key, the solid lines represent different epochs, 2008–2012, with a gradually increasing bow-shock density (see also Fig. 8). The three orange lines associated with the largest bow-shock density represent the set-ups for three different position angles of the bipolar outflow, δ = 0°, 45°, and 90°. The shaded rectangular region represents different angles of the bow-shock axis with respect to the line of sight for the period of 10 yr before the pericentre passage of the DSO, assuming a negligible motion of the ambient medium in comparison with the orbital velocity of the DSO. The horizontal dashed line marks the polarization degree value of pL = 30%, which is approximately the observationally inferred degree for the DSO (Shahzamanian et al. 2016).
Current usage metrics show cumulative count of Article Views (full-text article views including HTML views, PDF and ePub downloads, according to the available data) and Abstracts Views on Vision4Press platform.
Data correspond to usage on the plateform after 2015. The current usage metrics is available 48-96 hours after online publication and is updated daily on week days.
Initial download of the metrics may take a while.