Fig. 3
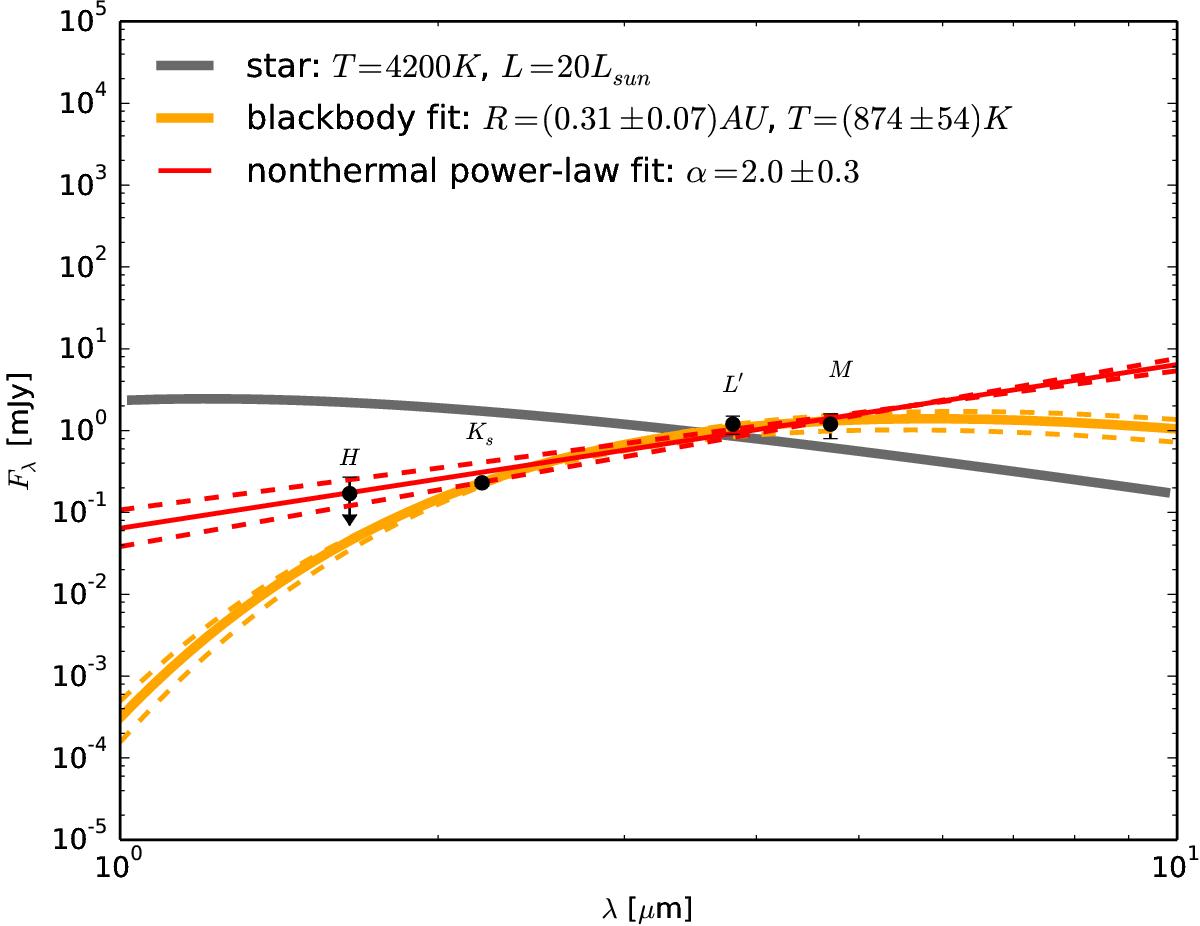
Detected, dereddened flux densities of the DSO (black points) and the fitted continuum: thermal black-body fit curve corresponding to warm dust (orange solid and dashed lines) and non-thermal power-law emission fit Sν ∝ ν− α with the index α = 2.0 ± 0.3 (red solid and dashed lines). For comparison, we also plot the black-body curve corresponding to the star of T⋆ = 4200 K and L⋆ = 20 L⊙ (pre-main-sequence star without a dusty envelope; grey solid line).
Current usage metrics show cumulative count of Article Views (full-text article views including HTML views, PDF and ePub downloads, according to the available data) and Abstracts Views on Vision4Press platform.
Data correspond to usage on the plateform after 2015. The current usage metrics is available 48-96 hours after online publication and is updated daily on week days.
Initial download of the metrics may take a while.